
The 8 Support & Resistance Zones indicator for Metatrader 5 is based on Fibonacci levels and draws 4 support zones and 4 resistance zones on the chart.
This indicator is useful for stop loss placement and take profit levels.
How to take profit with this indicator?
- Take profit for long trades when the price reaches the green, light-green, blue and light-blue colored resistance zones.
- Take profit for short trades when the price reaches the red, violet, orange and yellow colored support zones.
The following indicator inputs and parameters can be modified: Fibonacci ratios, support colors, and resistance colors.
The indicator works for any trading instrument (Forex, Stocks, Indices, Metals, etc.) that can be loaded into the Metatrader 5 platform.
First, familiarize yourself with this technical indicator and test it on a demo account.
It supports all time frames and Forex pairs.
Download Indicator 🆓
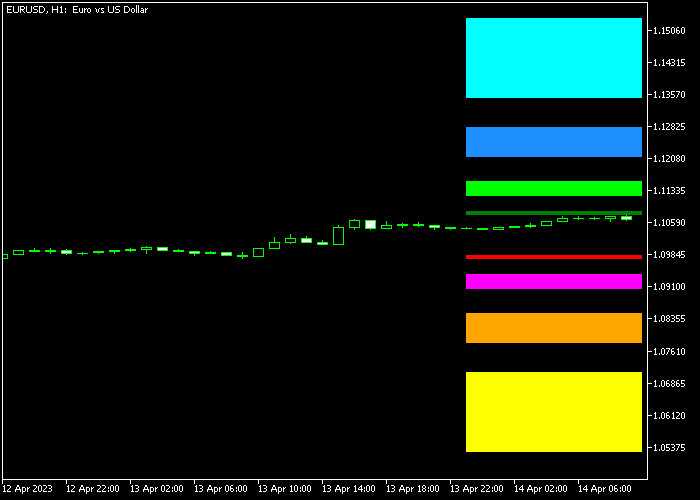
Chart Example
The following chart shows how the 8 Support & Resistance Zones Forex indicator looks when applied to the MT5 chart.
How To Buy And Sell Forex Pairs With The 8 Support & Resistance Zones Indicator?
Find a simple trading example below:
Buy Signal
- Use your own trading signals to open a buy trade.
- Place your stop loss at any of the Fibonacci support zones.
- Exit the buy trade at any of the Fibonacci resistance zones.
Sell Signal
- Use your own trading signals to open a sell trade.
- Place your stop loss at any of the Fibonacci resistance zones.
- Exit the buy trade at any of the Fibonacci support zones.
Download Now 🆓
Frequently Asked Questions
How Do I Install This Custom Indicator On Metatrader 5?
- Open the MT5 trading platform
- Click on the File menu button located at the top left part of the platform
- Click on Open Data Folder > MQL5 folder > Indicators
- Copy the Fib_SR_8.mq5 indicator file in the Indicators folder
- Close and restart the trading platform
- You will find the indicator here (Navigator window > Indicators)
- Drag the indicator to the chart to get started with it!
How Do I Edit This Indicator?
- Click in the open chart with your right mouse button
- In the dropdown menu, click on Indicator List
- Select the indicator and click on properties
- Now you can edit the inputs, colors, levels, scale and visualization
- Finally click the OK button to save the new configuration


