The MA Slope Forex Signal indicator for Metatrader 5 is a moving average that creates beginner friendly trading signals for any FX pair.
It incorporates the slope in its buy & sell trend calculations.
How to spot market trends with the Moving Average Slope indicator?
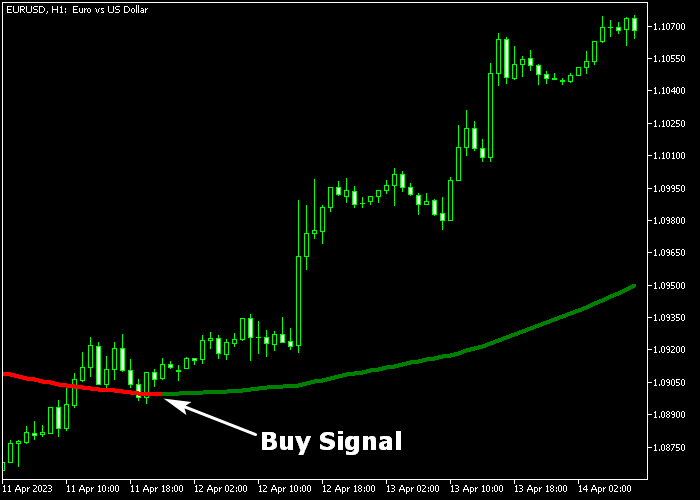
- A green colored line indicates a bullish trend.
- A red colored line indicates a bearish trend.
The indicator works for any trading instrument (Forex, Stocks, Indices, Metals, etc.) that can be loaded into the Metatrader 5 platform.
The following indicator inputs and parameters can be adjusted: period, method, applied price, slope, and slope length.
First, familiarize yourself with this technical indicator and test it on a demo account.
It supports all time frames and Forex pairs.
Download Indicator 🆓
Chart Example
The following chart shows how the MA Slope indicator looks when applied to the MT5 chart.

How To Buy And Sell Forex Pairs With The MA Slope Forex Indicator?
Find a simple trading example below:
Buy Signal
- A buy signal is given when the MA Slope indicator’s signal line is green colored.
- Open a long transaction and set your stop loss below support.
- Close the buy trade at prior resistance or for a fixed take profit target of your preference.
Sell Signal
- A sell signal is given when the MA Slope indicator’s signal line is red colored.
- Open a short transaction and set your stop loss above resistance.
- Close the sell trade at prior support or for a fixed take profit target of your preference.
Download Now 🆓
Frequently Asked Questions
How Do I Install This Custom Indicator On Metatrader 5?
- Open the MT5 trading platform
- Click on the File menu button located at the top left part of the platform
- Click on Open Data Folder > MQL5 folder > Indicators
- Copy the MA_Slope.mq5 indicator file in the Indicators folder
- Close and restart the trading platform
- You will find the indicator here (Navigator window > Indicators)
- Drag the indicator to the chart to get started with it!
How Do I Edit This Indicator?
- Click in the open chart with your right mouse button
- In the dropdown menu, click on Indicator List
- Select the indicator and click on properties
- Now you can edit the inputs, colors, levels, scale and visualization
- Finally click the OK button to save the new configuration


