About the Kaufman Efficiency Ratio indicator
The Kaufman Efficiency Ratio indicator for MT4 measures market efficiency on a scale from 0 to 1, helping traders identify overbought and oversold conditions.
Lower readings indicate oversold conditions and potential buy opportunities, while higher readings indicate overbought conditions and potential sell opportunities.
It works best when combined with a trend-following indicator, such as the 200 EMA, to confirm market direction.
By combining trend detection with efficiency readings, traders can enter trades with better timing and manage risk more effectively.
Free Download
Download the “kaufman-efficiency-ratio.mq4” MT4 indicator
Key Features
- Displays efficiency ratio values between 0 and 1 for market condition analysis.
- Identifies overbought and oversold areas for trend-following entries.
- Works best when combined with a trend indicator like the 200 EMA.
- Simple, easy-to-read interface suitable for beginners and advanced traders.
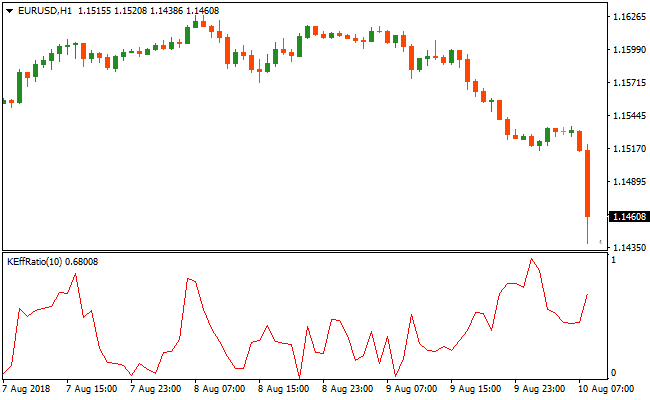
Indicator Chart
The image below shows the Kaufman Efficiency Ratio indicator below the main price chart.
Oversold readings near 0 highlight potential buy opportunities during an uptrend, while overbought readings near 1 highlight potential sell opportunities during a downtrend.
Traders can clearly see when price has deviated significantly from efficient movement, helping to identify entries that align with the overall trend direction.

Guide to Trade with Kaufman Efficiency Ratio
Buy Rules
- Confirm that the price is above the 200 EMA, indicating an uptrend.
- Wait for the Kaufman Efficiency Ratio to reach near 0 (oversold reading).
- Open a long position once the indicator begins to turn upward from oversold.
Sell Rules
- Confirm that the price is below the 200 EMA, indicating a downtrend.
- Wait for the Kaufman Efficiency Ratio to reach near 1 (overbought reading).
- Open a short position once the indicator begins to turn downward from overbought.
Stop Loss
- Place stop loss slightly below the most recent swing low for buys.
- Place stop loss slightly above the most recent swing high for sells.
- Consider moving stops to breakeven once the trade gains momentum.
Take Profit
- Close trades when the opposite signal appears (oversold/overbought reversal in line with trend).
- Alternatively, target nearby support or resistance levels for partial or full exit.
- Use a trailing stop following price swings to capture extended moves.
Kaufman Efficiency Ratio and VAR Moving Average MT4 Forex Strategy
This MT4 forex strategy combines the Kaufman Efficiency Ratio Indicator with the VAR Moving Average Indicator to create a trend-aligned mean-reversion strategy.
The VAR Moving Average uses green and red dotted lines to define the prevailing trend, while the Kaufman Efficiency Ratio identifies overbought and oversold conditions.
By entering trades when the trend aligns with an extreme reading, traders can capture profitable dips in an uptrend and rallies in a downtrend.
This strategy works well on M15 and H1 charts for major pairs like EURUSD, GBPUSD, and USDJPY.
It is suitable for day trading where price swings within the trend can provide multiple opportunities.
Buy Entry Rules
- The VAR Moving Average dotted line is green, indicating an uptrend.
- The Kaufman Efficiency Ratio reaches a reading of 0, signaling oversold conditions.
- Enter a buy trade at candle close when both conditions are met.
- Place the stop loss below the recent swing low or below the VAR Moving Average line.
- Exit the trade when the Kaufman Efficiency Ratio rises from the oversold region or when the dotted line turns red.
Sell Entry Rules
- The VAR Moving Average dotted line is red, indicating a downtrend.
- The Kaufman Efficiency Ratio reaches a reading of 1, signaling overbought conditions.
- Enter a sell trade at candle close when both conditions are met.
- Place the stop loss above the recent swing high or above the VAR Moving Average line.
- Exit the trade when the Kaufman Efficiency Ratio drops from the overbought region or when the dotted line turns green.
Advantages
- Combines trend direction and mean-reversion entries for higher probability trades.
- Visual signals make entries and exits easy to spot.
- Helps capture pullbacks and rallies within the prevailing trend.
- Works on multiple intraday timeframes including M15 and H1.
- Reduces risk of countertrend trades by requiring trend alignment.
- Suitable for day trading and swing trading sessions.
- Can be combined with support and resistance levels for additional precision.
Drawbacks
- Signals may lag slightly during rapid trend reversals.
- Requires monitoring of trend direction and Kaufman levels simultaneously.
- May produce fewer trades in flat or low-volatility periods.
- Patience is needed to wait for proper alignment of trend and indicator extremes.
Case Study 1
On EURUSD M15 during the London session, the VAR Moving Average showed a green dotted line indicating an uptrend.
The Kaufman Efficiency Ratio dropped to 0 after a minor pullback.
A buy trade was entered at candle close with a stop loss below the recent swing low.
Price rebounded strongly within the uptrend, and the trade was closed when the Kaufman ratio moved away from the oversold region, capturing 35 pips.
Case Study 2
On GBPAUD H1, the VAR Moving Average displayed a red dotted line showing a downtrend.
The Kaufman Efficiency Ratio reached 1 after a brief rally.
A sell trade was opened at candle close with the stop loss above the recent swing high.
Price declined steadily, and the position was exited when the ratio decreased from the overbought region, making 50 pips.
Strategy Tips
- Confirm the overall trend on higher timeframes before taking trades on lower timeframes.
- Use the Kaufman Efficiency Ratio extremes as entry signals, not as exit points alone.
- Combine with recent swing highs and lows to refine stop and exit placement.
- Avoid trading during low volatility periods to reduce false entries.
- Adjust position sizes according to volatility and trend strength.
- Be patient and wait for the perfect alignment of trend and oversold/overbought readings.
Download Now
Download the “kaufman-efficiency-ratio.mq4” Metatrader 4 indicator
FAQ
Do I need another indicator to use Kaufman Efficiency Ratio?
Yes, it works best with a trend-following tool like the 200 EMA to ensure trades align with overall market direction.
How do I interpret extreme readings?
Readings near 0 suggest oversold conditions, indicating potential buy opportunities in an uptrend.
Readings near 1 suggest overbought conditions, indicating potential sell opportunities in a downtrend.
Is it beginner-friendly?
Yes, the indicator provides simple numeric readings and clear trend alignment guidance, making it easy for beginners to apply in trading strategies.
Summary
The Kaufman Efficiency Ratio indicator provides precise overbought and oversold signals to help traders identify high-probability entries in line with the trend.
When combined with a trend-following tool like the 200 EMA, it allows traders to buy dips in an uptrend and sell rallies in a downtrend.
Proper stop loss and take profit management ensures trades remain low-risk while maximizing trend capture.


