
About the Fibonacci Levels with Support and Resistance Indicator
The Fibonacci Levels with Support and Resistance Indicator for MT5 helps traders identify key price zones based on Fibonacci ratios.
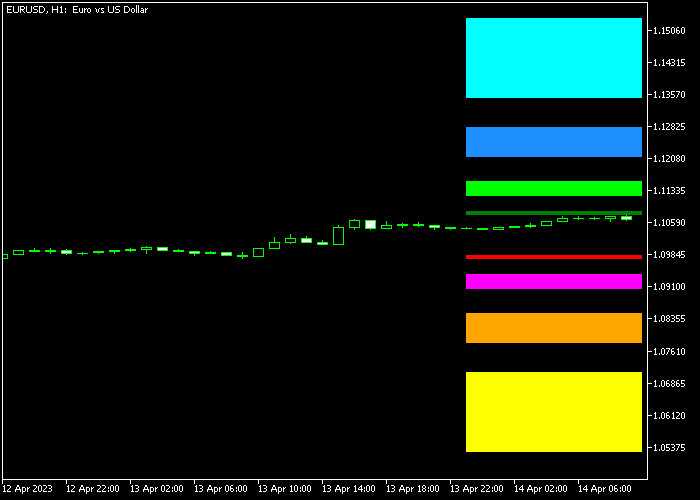
It automatically draws four support zones and four resistance zones directly on the chart, providing clear reference points for entries, stop losses, and take profits.
This indicator is particularly useful for traders who rely on Fibonacci retracements and extensions as part of their strategy.
The support and resistance zones can help determine where price might reverse or continue, making it easier to plan trades and manage risk.
Take profit levels can be identified using the resistance zones for long trades and the support zones for short trades.
Similarly, stop losses can be placed just beyond the corresponding support or resistance zone to protect trades from unexpected price movements.
Traders can adjust Fibonacci ratios and customize the colors of support and resistance zones to suit their visual preferences.
This flexibility allows for easier interpretation of the market structure while maintaining precision in trade management.
Free Download
Key Features
- Draws four support and four resistance zones using Fibonacci ratios.
- Helps identify potential take profit and stop loss levels.
- Customizable Fibonacci ratios for personalized analysis.
- Adjustable support and resistance zone colors.
- Useful for planning entries, exits, and risk management.
- Can be combined with other trading signals and strategies.
Indicator Chart
The Fibonacci Levels with Support and Resistance Indicator appears on the main price chart, showing four support zones and four resistance zones in distinct colors.
These zones guide traders on potential reversal points and trade management levels.
Guide to Trade with Fibonacci Levels with Support and Resistance Indicator
Buy Rules
- Use your own trading signals to determine a buy entry.
- Place your stop loss at one of the Fibonacci support zones.
- Target take profit at any of the Fibonacci resistance zones.
Sell Rules
- Use your own trading signals to determine a sell entry.
- Place your stop loss at one of the Fibonacci resistance zones.
- Target take profit at any of the Fibonacci support zones.
Stop Loss
- Set stop losses just beyond the nearest Fibonacci support zone for buy trades.
- Set stop losses just beyond the nearest Fibonacci resistance zone for sell trades.
- Use multiple zones as reference points for tighter or wider stops.
Take Profit
- Close buy trades when price reaches any of the colored resistance zones (green, light-green, blue, or light-blue).
- Close sell trades when price reaches any of the colored support zones (red, violet, orange, or yellow).
- Optionally exit trades early if price shows signs of reversal near a zone.
- Scale out profits across multiple zones for partial exits.
Fibonacci Levels Day Trading Strategy for MT5
This day trading strategy combines the Fibonacci Levels with Support and Resistance Indicator with the EMA Levels Forex Indicator to create a simple and effective intraday approach.
The EMA Levels indicator provides clear entry signals using its color-coded lines.
A green line signals buying pressure while an orange line signals selling pressure.
This helps traders react quickly to market direction.
The Fibonacci Levels with Support and Resistance Indicator is used to define precise stop loss and take profit areas.
These levels act as natural barriers where price often reacts or reverses, making them ideal for managing trades.
This strategy works best on M5 to M15 timeframes.
Buy Entry Rules
- Wait for the EMA Levels indicator to print a green line, confirming bullish direction.
- Enter a buy trade at the opening of the next candle after the green signal appears.
- Place the stop loss at the nearest Fibonacci support level below the entry.
- Set the take profit at the next Fibonacci resistance level above the entry.
- If price stalls near resistance, consider closing early based on price reaction.
Sell Entry Rules
- Wait for the EMA Levels indicator to print an orange line, confirming bearish direction.
- Enter a sell trade at the opening of the next candle after the orange signal appears.
- Place the stop loss at the nearest Fibonacci resistance level above the entry.
- Set the take profit at the next Fibonacci support level below the entry.
- Exit early if price shows strong rejection near support.
Case Study 1: Buy Trade on AUDUSD M15
On the AUDUSD pair using the M15 timeframe, the EMA Levels indicator printed a green line, signaling a bullish move.
Price had recently pulled back into a Fibonacci support zone, creating alignment between entry and structure.
A buy trade was opened at the next candle. The stop loss was placed just below the nearest Fibonacci support level.
The long trade was closed after price touched the next resistance level identified by the Fibonacci indicator.
Case Study 2: Sell Trade on GBPUSD M5
On GBPUSD using the M5 timeframe, the EMA Levels indicator showed an orange line, indicating bearish pressure.
Price had just reacted from a Fibonacci resistance level, adding confluence to the setup.
A sell trade was entered at the next candle open. The stop loss was placed just above the Fibonacci resistance level.
Price moved slowly downward toward the next Fibonacci support level, where it was exited.
Download Now
FAQ
Do I need another indicator to use it?
The indicator itself does not generate buy or sell signals. Traders should combine it with their own trading strategies or other indicators to determine entry points.
Can I customize the colors of the zones?
Yes. Traders can modify the colors for support and resistance zones to improve visual clarity and personal preference.
What are the main benefits of this indicator?
It provides clear levels for stop loss placement, take profit targets, and trend reversal monitoring, helping traders manage risk and improve trade timing.
Summary
The Fibonacci Levels with Support and Resistance Indicator makes it easy to identify key zones for trade management.
By combining four support and four resistance levels with standard Fibonacci ratios, traders can place stop losses and take profits more precisely.
Its visual simplicity and customization options allow traders to quickly interpret market structure and plan trades accordingly.
The indicator works well as a complement to existing trading strategies, helping improve risk management and trade execution efficiency.


