About the VMA Forex Trend Alert Indicator
The VMA Forex Trend Alert indicator for MT5 is a trend-following tool that helps traders identify market direction through a dynamic signal line.
It calculates trend strength using a Variable Moving Average and displays the result directly on the price activity as a color-changing line.
The indicator switches colors depending on the current trend condition.
A green signal line indicates bullish market momentum, while a violet signal line signals bearish pressure.
Because the VMA adapts to market volatility, the signal line reacts differently during trending and slower market phases.
This allows the indicator to follow price movement more closely while still filtering weaker fluctuations.
Traders can adjust several settings including the VMA period, VHF period, price type, and step size measured in pips.
These options allow the indicator to be tuned for different currency pairs and trading approaches.
Free Download
Step VHF adaptive VMA.mq5 Indicator (MT5)
Key Features
- Variable Moving Average signal line that adapts to market conditions.
- Dual-colored trend line that highlights bullish and bearish phases.
- Customizable VMA and VHF period settings.
- Adjustable step size measured in pips.
- Compatible with any timeframe and trading instrument.
- An alert feature that notifies traders when trend changes occur.
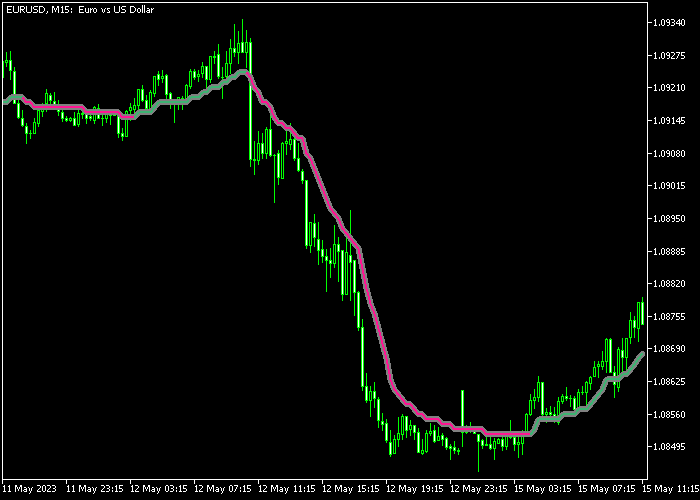
Indicator Chart
The VMA Forex Trend Alert indicator appears on the main price window as a dual-colored signal line that changes color based on market direction.
The example shows how the line turns green during bullish movement and violet when the market shifts into a bearish phase, helping traders identify potential entry points during trend transitions.

Guide to Trade with VMA Forex Trend Alert Indicator
Buy Rules
- Watch for the signal line to switch from violet to green.
- This change indicates that bullish momentum may be developing.
- Confirm that price begins moving upward with the new trend line.
- Open a buy trade shortly after the green signal line appears.
Sell Rules
- Watch for the signal line to change from green to violet.
- This shift signals that bearish pressure may be entering the market.
- Confirm that price starts moving lower alongside the violet line.
- Open a sell trade after the bearish trend signal forms.
Stop Loss
- Place the stop loss slightly below the recent market low for buy trades.
- Place the stop loss slightly above the recent market high for sell trades.
- Another option is positioning the stop a few pips beyond a nearby support or resistance level.
Take Profit
- Close the trade when the indicator switches to the opposite colored signal line.
- Exit the position when price begins to move against the current trend direction.
- Traders may also trail the stop to lock in profits as the trend continues.
VMA Forex Trend Alert Forex Scalping Strategy for MT5
This scalping strategy combines the VMA Forex Trend Alert Indicator with the Zone Trade Histogram Scalper Indicator for fast intraday trading on M1 and M5 charts.
The VMA indicator defines the main market direction. A green VMA line shows bullish trend conditions, while a violet line shows bearish trend conditions.
This helps traders avoid counter-trend scalping and focus only on aligned momentum.
The Zone Trade Histogram provides precise entry timing.
A blue histogram bar signals a buy opportunity, while an orange histogram bar signals a sell opportunity.
This combination allows traders to catch short bursts of momentum inside an established trend.
This strategy works best on highly liquid pairs such as EURUSD, GBPUSD, USDJPY, and XAUUSD during London and New York sessions where volatility creates frequent short moves.
Buy Entry Rules
- Confirm that the VMA trend indicator line is green, indicating a bullish trend direction.
- Wait for price to remain above the VMA line or react positively to it.
- Enter a buy trade when a blue histogram bar appears from the Zone Trade indicator.
- Place the stop loss below the most recent swing low or below the VMA line.
- Take profit or close the trade when an orange histogram bar appears, or when the VMA turns violet.
Sell Entry Rules
- Confirm that the VMA trend indicator line is violet, indicating a bearish trend direction.
- Wait for price to remain below the VMA line or react negatively to it.
- Enter a sell trade when an orange histogram bar appears from the Zone Trade indicator.
- Place the stop loss above the most recent swing high or above the VMA line.
- Take profit or close the trade when a blue histogram bar appears, or when the VMA turns green.
Case Study 1: EURUSD M5 London Session Bullish Scalping Setup
On EURUSD M5 during the London session, the VMA line was green, showing a clear bullish direction.
Price stayed above the VMA and started forming small pullbacks.
A blue histogram bar appeared, confirming a buy signal.
A long trade was opened immediately after the candle closed.
The trade was closed for 22 pips when an orange histogram bar appeared shortly after a short upward push.
Case Study 2: GBPJPY M1 New York Session Bearish Scalping Setup
On GBPJPY M1 during the New York session, the VMA line was violet, confirming bearish trend conditions.
Price remained below the VMA and started moving in short downward bursts.
An orange histogram bar appeared, triggering a sell entry after confirmation of downward momentum.
15 min later, the trade was closed for a small loss when a blue histogram bar appeared soon after a small drop, indicating a short-term bullish trend reversal.
Download Now
Step VHF adaptive VMA.mq5 Indicator (MT5)
FAQ
What makes the VMA indicator different from a regular moving average?
The Variable Moving Average adapts its calculation depending on market volatility and trend strength.
This allows it to react faster during strong trends while slowing down during quieter market conditions.
What does the VHF period control?
The VHF period influences how the indicator measures trend strength.
Higher values generally smooth the signal line, while lower values make the indicator react more quickly to price movement.
Can the VMA Forex Trend Alert indicator generate alerts?
Yes. The indicator includes an alert function that notifies traders when a new trend signal appears.
Summary
The VMA Forex Trend Alert indicator helps traders follow market direction using a dynamic signal line that adapts to changing conditions.
The color shift between green and violet provides an immediate visual indication of bullish or bearish momentum.
Its adjustable parameters allow traders to tune the indicator for different trading styles and market environments.
The alert functionality also helps identify trend changes without constant monitoring.
When used together with additional confirmation tools, the VMA indicator can assist traders in spotting potential trend opportunities and managing positions more effectively.


