The Vidya Forex Trend indicator for Metatrader 5 delivers non-repaint buy & sell signals based on momentum and the Vidya trading formula.
The indicator appears as an alternating-colored signal line in the price chart.
Understanding the Vidya Forex Trend indicator:
- A buy trend is in place when the line color is green.
- A sell trend is in place when the line color is purple.
- The indicator is always active in the currency market.
The following indicator inputs and parameters can be modified: Vidya period, momentum period, and price.
Scalpers and day traders will benefit the most from this indicator during the most volatile trading sessions (London, New York).
Make yourself familiar with this technical indicator and test it first on a demo account for an extended period.
It supports all time frames and Forex pairs.
Download Indicator 🆓
Chart Example
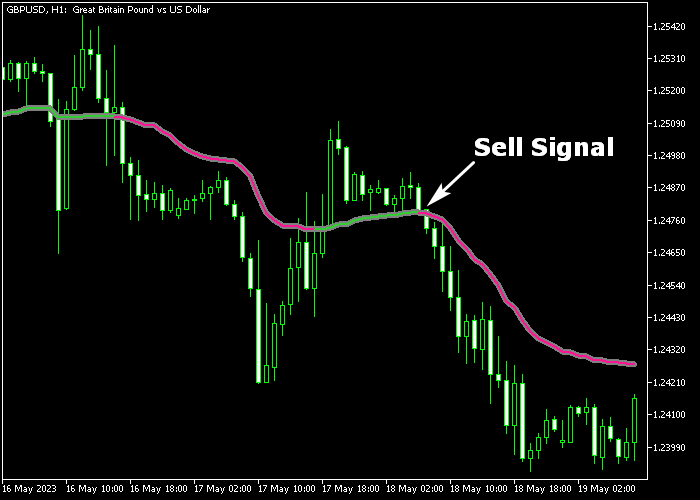
The following chart shows what the Vidya Forex Trend indicator looks like when applied to the MT5 chart.

How To Buy And Sell FX Pairs With The Vidya Forex Trend Indicator?
Find a simple trading example below:
Buy Signal
- A buy signal is given when the Vidya signal line is colored green.
- Open a buy trade and place a stop loss order below the most recent swing low level.
- Exit the buy trade for a fixed take profit, or reverse the trade when the purple colored signal line appears in the chart.
Sell Signal
- A sell signal is given when the Vidya signal line is colored purple.
- Open a sell trade and place a stop loss order above the most recent swing high level.
- Exit the sell trade for a fixed take profit, or reverse the trade when the green colored signal line appears in the chart.
Download Now 🆓
Frequently Asked Questions
How Do I Install This Custom Indicator On Metatrader 5?
- Open the MT5 trading platform
- Click on the File menu button located at the top left part of the platform
- Click on Open Data Folder > MQL5 folder > Indicators
- Copy the Vidya.mq5 indicator file in the Indicators folder
- Close and restart the trading platform
- You will find the indicator here (Navigator window > Indicators)
- Drag the indicator to the chart to get started with it!
How Do I Edit This Indicator?
- Click in the open chart with your right mouse button
- In the dropdown menu, click on Indicator List
- Select the indicator and click on properties
- Now you can edit the inputs, colors, levels, scale and visualization
- Finally click the OK button to save the new configuration


