About the Day Borders Indicator
The Day Borders Indicator for MT5 is an overlay tool that marks important daily price levels directly on the chart.
It automatically draws horizontal and vertical lines to show the open and close levels of the trading day, as well as the start and end boundaries.
These visual levels help traders identify daily range conditions, breakout opportunities, and session transitions.
By clearly marking where the previous day opened and closed, the indicator highlights key reference points that often act as support and resistance.
The tool is especially useful for breakout traders who focus on daily highs and lows.
Instead of manually drawing lines, the indicator updates these levels automatically with each new trading day.
You can customize the types of prices used for calculation, as well as the color of the open level, close level, start line, end line, and line styles to match your chart template.
Free Download
dayborders.mq5 Indicator (MT5)
Key Features
- Automatically draws daily open and close levels.
- Displays vertical start and end day lines.
- Highlights the previous day’s high and low reference points.
- Works on all timeframes.
- Customizable line colors and styles.
- Adjustable price type calculations.
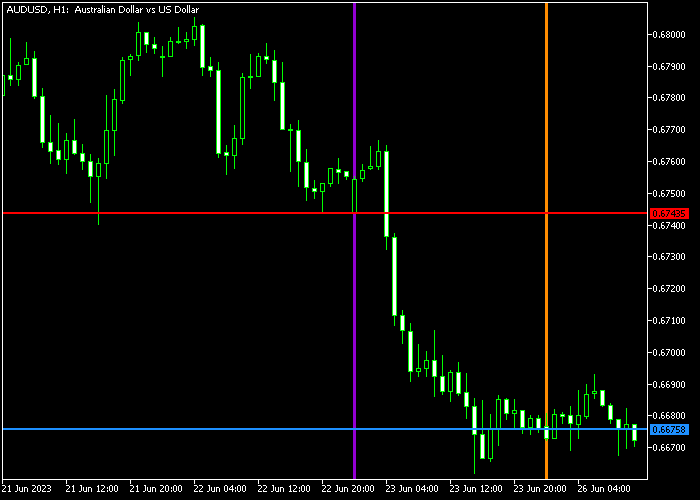
Indicator Chart
The Day Borders Indicator appears on the main price area and draws colored horizontal lines for daily open and close levels, along with vertical lines marking the start and end of the day.
Traders can easily spot the previous day’s range and monitor price interaction with those levels.
Breakouts above the high or below the low often signal continuation opportunities.

Guide to Trade with the Day Borders Indicator
Buy Rules
- Identify an overall upward trending market.
- Mark the previous day’s high level displayed by the indicator.
- Wait for a strong candle to break and close above the previous day’s high.
- Enter a buy trade at the open of the next candle.
Sell Rules
- Identify an overall downward trending market.
- Mark the previous day’s low level displayed by the indicator.
- Wait for a strong candle to break and close below the previous day’s low.
- Enter a sell trade at the open of the next candle.
Stop Loss
- For buy trades, place the stop below the breakout candle low.
- For sell trades, place the stop above the breakout candle high.
- Alternatively, use the opposite side of the daily range as protection.
Take Profit
- Target the next major resistance level for buy trades.
- Target the next major support level for sell trades.
- Use a fixed pip profit target of your preference.
Day Borders MT5 Guppy Zones Forex Strategy
This strategy combines the Day Borders Forex Indicator for MT5 with the Guppy Zones Forex Indicator for MT5 to create a powerful intraday trading approach.
It focuses on clear breakout levels from the previous day while aligning trades with the underlying market trend.
The idea is simple. The Day Borders indicator provides key daily high and low levels that act as natural breakout zones.
The Guppy Zones indicator confirms trend direction using short-term and long-term moving averages.
When both align, the setup becomes more reliable.
It also helps reduce false breakouts by requiring confirmation from both price action and trend behavior.
This strategy works best on intraday timeframes such as M15 and H1.
Buy Entry Rules
- Mark the previous day’s high level shown by the Day Borders indicator.
- Wait for a strong bullish candle to break and close above this level.
- Confirm that short-term moving averages are positioned above long-term moving averages on the Guppy Zones indicator.
- Enter a buy trade after the breakout candle closes.
- Place the stop loss below the breakout level or below the most recent minor support.
- Take profit when the Guppy Zones indicator shows weakening bullish alignment or price reaches a clear resistance area.
Sell Entry Rules
- Mark the previous day’s low level shown by the Day Borders indicator.
- Wait for a strong bearish candle to break and close below this level.
- Confirm that short-term moving averages are positioned below long-term moving averages on the Guppy Zones indicator.
- Enter a sell trade after the breakout candle closes.
- Place the stop loss above the breakout level or above the most recent minor resistance.
- Take profit when the Guppy Zones indicator shows weakening bearish alignment or price reaches a clear support area.
Case Study 1 Buy Trade (EURUSD, M15)
During a London session, price approached the previous day’s high marked by the Day Borders indicator.
A strong bullish candle broke above this level and closed with clear momentum.
At the same time, the Guppy Zones indicator showed short-term moving averages stacked above long-term averages, confirming a bullish trend.
A buy trade was opened immediately after the breakout candle closed.
The stop loss was placed just below the previous day’s high.
Price continued moving upward with strong momentum.
The trade was closed when the Guppy alignment started to compress, signaling a slowdown in bullish strength.
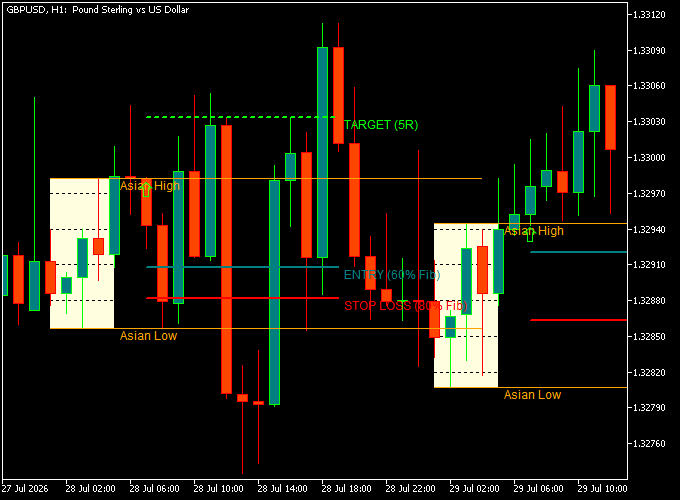
Case Study 2 Short Trade (GBPUSD, H1)
Later in the week, price tested the previous day’s low during the New York session.
A strong bearish candle broke and closed below this level, confirming a downside breakout.
The Guppy Zones indicator showed short-term averages clearly below long-term averages, indicating a bearish trend.
A sell trade was executed after the candle close. The stop loss was placed just above the previous day’s low.
Price moved downward steadily.
The trade was closed when price approached a support zone and the Guppy structure began to lose its bearish separation.
Download Now
dayborders.mq5 Indicator (MT5)
FAQ
What price types can be used for calculations?
The indicator allows you to choose different price types depending on your trading preference. This flexibility lets you align it with your analysis method.
Can I change the line colors?
Yes, you can modify the color of the daily open, daily close, start line, and end line, along with the line style.
Is this indicator suitable for lower timeframes?
Yes, it works on all timeframes. Many traders apply it on intraday charts to trade daily range breakouts.
Does it automatically update each new day?
Yes, the indicator recalculates and redraws the daily levels as soon as a new trading day begins.
Summary
The Day Borders Indicator provides a simple way to track daily open and close levels without manual drawing.
It helps traders focus on breakout opportunities around the previous day’s range.
With customizable visual settings and automatic updates, it supports consistent daily range analysis.
Traders who focus on momentum and breakout strategies can use it to improve timing and level precision.