
About the Ichimoku Indicator
The Ichimoku indicator for MT5 is a technical tool that provides a comprehensive view of market momentum and trend direction.
It uses a specialized cloud-based system to identify areas of support and resistance while filtering out market noise.
Unlike standard versions, this indicator focuses on simplified cloud signals that are 100% non-repainting.
This ensures that once a trend is identified on the chart, the data remains fixed for reliable execution and backtesting.
The indicator is designed to help traders stay on the right side of the market by visualizing the balance between buyers and sellers.
It works effectively as a standalone signal generator or as a confirmation layer within a broader trading system.
Free Download
Key Features
- The indicator generates light-brown and gray clouds to represent bullish and bearish trends.
- Signals are 100% non-repainting, providing a stable historical record of market sentiment.
- Adjustable parameters for Tenkan-sen, Kijun-sen, and Senkou Span B allow for customized sensitivity.
- The visual interface simplifies complex Ichimoku calculations into easy-to-read trend zones.
Indicator Chart
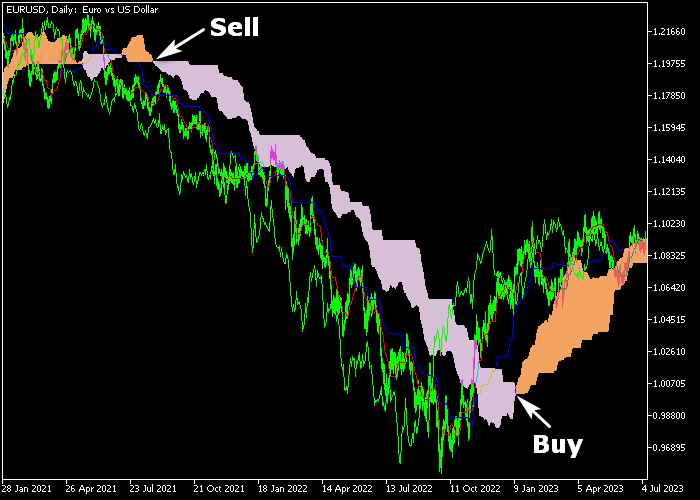
The chart below shows the Ichimoku indicator for MT5, highlighting the trend through shaded cloud areas.
You can see how the light-brown cloud follows rising prices, while the gray cloud marks the start of a bearish decline.
These zones act as a visual guide for determining the dominant market bias.
Guide to Trade with the Ichimoku indicator
Buy Rules
- A bullish trading signal is given when the light-brown colored Ichimoku cloud appears in the price chart.
- Execute a buy market order immediately once the bullish cloud color is confirmed on a closed candle.
- Verify that the price action is maintaining its position above the cloud to confirm trend strength.
- Maintain the long position as long as the cloud remains light-brown and price holds the support level.
Sell Rules
- A bearish trading signal is given when the gray colored Ichimoku cloud appears in the price chart.
- Open a sell market order as soon as the gray cloud is displayed to signal a downward shift.
- Ensure the price remains below the gray cloud area to validate the ongoing bearish momentum.
- Keep the short trade active until the indicator generates an opposite bullish signal.
Stop Loss
- Place your stop loss below the light-brown cloud for all buy market orders.
- Set a protective stop loss above the gray cloud for sell positions.
- The edges of the cloud can also serve as dynamic reference points for placing logical stops.
- Adjust the stop to break-even once the trade moves significantly into profit to manage risk effectively.
Take Profit
- Close the trade for a fixed take profit target based on a reward to risk ratio of 2.5.
- Alternatively, hold the position and wait for the opposite colored cloud signal to appear.
- Manual exits are recommended if the cloud begins to narrow significantly, indicating a potential range.
Ichimoku Cloud MT5 Day Trading Strategy
This strategy combines the structure of the Ichimoku Cloud with the timing precision of the Disparity Index Indicator to create a clear day trading approach.
The Ichimoku Cloud provides a full view of trend direction and key support and resistance zones, helping traders quickly identify whether the market is trending or ranging.
The Disparity Index adds a momentum layer by measuring how far price is from its moving average.
When it moves above or below its baseline, it reflects bullish or bearish pressure in the market.
This combination works well on M15 and M30 timeframes and is ideal for traders who want structured entries during active sessions like London and New York.
Buy Entry Rules
- Wait for the Ichimoku cloud to turn light-brown, confirming a bullish trend.
- Price should remain above the cloud, showing strong directional bias.
- Enter a buy trade when the Disparity Index prints a blue histogram.
- Place the stop loss below the nearest support zone or below the cloud.
- Close the trade when the Disparity Index turns red or price moves back into the cloud.
- Alternatively, target the next resistance level.
Sell Entry Rules
- Wait for the Ichimoku cloud to turn gray, confirming a bearish trend.
- Price should stay below the cloud, indicating sustained downside pressure.
- Enter a sell trade when the Disparity Index shows a red histogram.
- Place the stop loss above the nearest resistance level or above the cloud.
- Close the trade when the Disparity Index turns blue or price re-enters the cloud.
- Alternatively, aim for the next support level.
Case Study 1: EUR/USD Buy Trade
During the London session, EUR/USD was trading above a light-brown cloud, showing a stable uptrend.
Price respected the cloud as dynamic support and continued pushing higher.
Shortly after a minor pullback, the Disparity Index shifted to a blue histogram, confirming renewed bullish momentum.
A buy trade was opened in line with the trend.
The position was protected below the cloud structure.
As momentum continued, price moved steadily upward until the Disparity Index flipped red, signaling weakening strength.
The trade was closed with a clean intraday gain.
Case Study 2: GBP/JPY Sell Trade
In the New York session, GBP/JPY moved below a gray cloud, indicating a bearish environment.
Price attempted small retracements but failed to break back into the cloud, reinforcing downside pressure.
When the Disparity Index printed a red histogram, a sell trade was taken.
The stop loss was placed above the cloud to allow room for minor pullbacks.
The market continued downward with strong momentum.
The trade was exited when the histogram turned blue, capturing a solid move within the session.
Download Now
FAQ
What do the cloud colors signify?
The light-brown cloud represents a bullish trend, while the gray cloud indicates a bearish trend.
Can I change the period settings?
Yes, the inputs for Tenkan-sen, Kijun-sen, and Senkou Span B can be modified.
This helps align the indicator with different trading styles and timeframes.
Is this indicator suitable for beginners?
The simplified cloud signals make it very user-friendly for novice traders.
It provides a straightforward visual method for following trends without needing to interpret complex lines.
Summary
The Ichimoku indicator is a popular trend analysis tool offering reliable signals for buying and selling pairs in the Forex market.
It identifies market momentum accurately through a non-repainting cloud system, providing a stable foundation for technical analysis.
By focusing on simplified visual triggers, it helps traders capture long-term trends while avoiding choppy market conditions.
Overall, it is a robust and versatile tool for anyone seeking a clear perspective on market structure.


