
About the Kagi Indicator
The Kagi indicator for MT5 is a technical tool that identifies trend direction based on price action and market sentiment.
It provides non-repainting buy and sell signals by tracking momentum shifts across any currency pair.
This approach allows traders to stay aligned with the dominant trend while ignoring the noise typically found in choppy markets.
When the market moves beyond a predefined threshold, the indicator changes color and direction, signaling a potential new trend.
This makes it an efficient tool for identifying key reversal points and confirming trend strength.
Free Download
Key Features
- The indicator provides clear buy and sell signals through color-coded trend lines.
- The non-repainting nature of the signals ensures technical data remains consistent for backtesting.
- Customizable settings include threshold, size, and percentage values to adapt to different market conditions.
- The tool is effective for scalping, day trading, and long-term swing trading strategies.
- It reacts to price reversals rather than time, offering a unique perspective on trend strength.
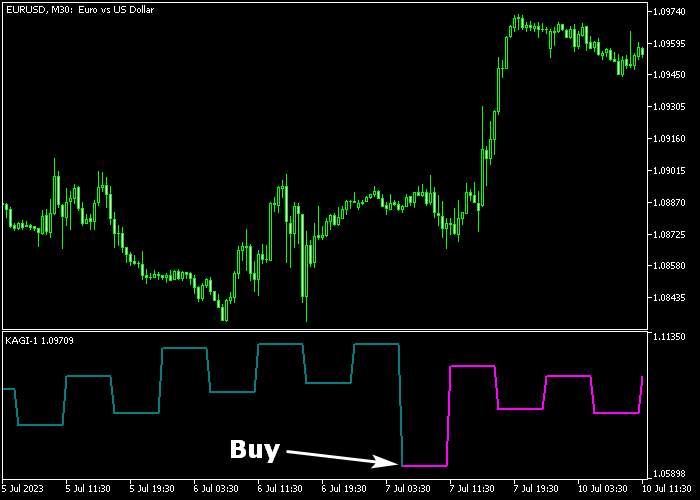
Indicator Chart
The chart shows the Kagi indicator for MT5 displaying teal and magenta lines.
The teal color represents a bullish trend, while the magenta color indicates a bearish shift.
Traders can easily identify entry points when the line color transitions.
Guide to Trade with the Kagi Indicator
Buy Rules
- A buy signal is triggered when the Kagi indicator starts a new teal colored line.
- Ensure the price is currently trading above the 200 EMA to confirm a broader bullish trend.
- Execute a buy market order immediately upon the appearance of the teal line.
- Maintain the position as long as the line stays teal and price holds above the 200 EMA.
Sell Rules
- A sell signal occurs when the indicator displays the start of a magenta colored line.
- Verify that the price is positioned below the 200 EMA to align with the bearish momentum.
- Open a sell market order as soon as the magenta line is confirmed on the chart.
- Keep the short trade active while the magenta line persists and the 200 EMA remains above price.
Stop Loss
- Set a protective stop loss below the previous swing low level for all buy positions.
- Place your stop loss above the previous swing high level for any sell market orders.
- Utilize the 200 EMA as a secondary reference point for placing logical exit stops.
- Adjust the stop loss to break-even once the trade moves into profit to protect your capital.
Take Profit
- Close the buy trade when a magenta sell line appears on the chart.
- For short positions, exit as soon as the indicator displays the teal buy line.
- Targeting major support or resistance levels can also provide effective exit points.
Kagi Indicator Scalping Strategy for MT5 with BSI Trend Confirmation
This scalping strategy combines the Kagi Indicator with the BSI Trend Indicator to capture quick market moves with strong trend confirmation.
The Kagi Indicator focuses on price movement rather than time, filtering out noise and highlighting real directional shifts.
It changes direction only when price moves significantly, making it highly effective for spotting clean entries.
The BSI Trend Indicator complements this by showing overall market direction through a colored line.
A dark-blue line signals bullish pressure, while a pink line indicates bearish conditions, helping traders stay aligned with the dominant trend.
This combination works best on M1 and M5 charts for fast execution.
It’s built for traders who prefer quick entries with confirmation rather than reacting to every small fluctuation.
Buy Entry Rules
- Wait for the Kagi Indicator line to turn teal, indicating a bullish shift.
- Confirm that the BSI Trend Indicator shows a dark-blue line.
- Enter a buy trade at the open of the next candle.
- Place the stop loss just below the most recent short-term support level.
- Close the trade when the Kagi line turns magenta or when the BSI line switches to pink.
Sell Entry Rules
- Wait for the Kagi Indicator line to turn magenta, signaling a bearish shift.
- Confirm that the BSI Trend Indicator shows a pink line.
- Enter a sell trade at the open of the next candle.
- Set a stop loss just above the most recent short-term resistance level.
- Close the trade when the Kagi line turns teal or when the BSI line switches to dark-blue.
Case Study 1
On GBPJPY M1, price had been moving sideways before a sharp upward push formed.
The Kagi Indicator shifted to a teal line, signaling a bullish breakout.
At the same time, the BSI Trend Indicator turned dark-blue, confirming strong upward pressure.
A buy trade was opened at the next candle.
Momentum accelerated quickly, and price moved higher in a clean burst.
The position was closed when the Kagi line flipped to magenta, securing a quick 12 pip scalp profit.
Case Study 2
On EURAUD M5, the market showed signs of exhaustion after a short rally.
The Kagi Indicator turned magenta, indicating a bearish reversal.
Simultaneously, the BSI Trend Indicator switched to pink, confirming downside momentum.
A sell trade was entered at the next candle open.
Price dropped steadily with minimal pullbacks, offering a smooth trade.
The trade was closed when the Kagi line turned teal again, signaling a possible short-term reversal.
Download Now
FAQ
How do I use the 200 EMA as a filter?
The 200 EMA identifies the primary trend.
By only taking Kagi signals that align with the EMA, you filter out counter-trend trades that have a higher risk of failing.
Can this indicator be used for scalping?
Yes, it is very effective on M1 and M5 timeframes.
For the best results, trade during the London and New York sessions when volatility is highest.
What do the threshold and size settings do?
These parameters control the sensitivity of the indicator.
Lower values make it react to smaller price moves, while higher values focus on major trend shifts.
Summary
The Kagi indicator is a popular trend analysis tool offering reliable signals for buying and selling pairs in the Forex market.
When combined with the 200 EMA, it effectively filters out low-probability setups by ensuring trades align with the long-term trend.
This combination provides a disciplined framework for managing entries and exits across various timeframes.
Overall, it is a versatile tool for traders who prioritize price-action based momentum signals.


