About the Multi Pair Pivot Point Scanner Alerts V2.8 Indicator
The Multi Pair Pivot Point Scanner Alerts V2.8 Indicator for MetaTrader 5 is a pivot based dashboard that scans multiple symbols at the same time.
It tracks daily, weekly, or custom pivot levels and highlights when price crosses or reacts to those levels.
This gives you instant insight into potential entries, stop placements, and profit targets without flipping through many charts.
The dashboard shows pivot points together with the nearest support and resistance levels, so you can see where price is likely to pause or reverse.
Because the tool updates in real time, you can react quickly when a pair breaks through a pivot or bounces at S or R levels.
Free Download
Multi_Pair_Pivot_Point_Scanner_Alerts_v2.8.mq5 Indicator (MT5)
Key Features
- Multi pair scanner that monitors many symbols for pivot point, support, and resistance interactions.
- Real time alerts when price crosses the main pivot or key levels such as S1, S2, S3, R1, R2, and R3.
- Dashboard style display in the main chart window that shows all pairs and their current pivot status.
- Configurable pivot point formula and timeframe so you can choose classic, Fibonacci, or other pivot methods.
- Flexible alert options including popup, push notifications, and email alerts for important signals.
- Extra filters such as bounce settings and optional Bollinger Bands integration to refine trade setups.
- Symbol prefix and suffix settings to match different broker naming conventions for currency pairs.
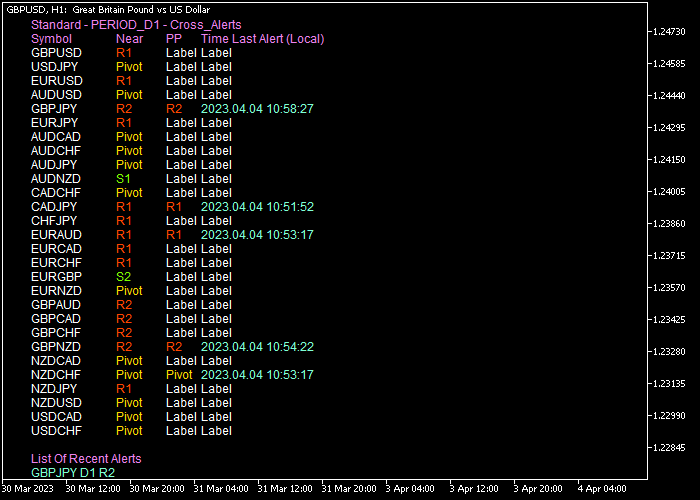
Indicator Chart
On the chart, the indicator appears as a pivot point dashboard instead of a single line.
The dashboard lists each symbol together with its main pivot, closest support and resistance, and signal status.
You can immediately see which pairs are trading above the pivot, which are below, and which are interacting with S or R levels.

Guide to Trade with the Multi Pair Pivot Point Scanner Alerts V2.8 Indicator
Buy Rules
- Look for pairs on the dashboard where price has crossed above the selected pivot point level for the current session.
- Confirm that the scanner displays a bullish status or a recent alert for a pivot break to the upside.
- Open a buy trade once the candle closes above the pivot, using the dashboard to check that nearby resistance leaves enough room for profit.
- Stay in the trade while price holds above the pivot or continues to move toward the next resistance levels.
Sell Rules
- Look for pairs where price has crossed below the current pivot point on the dashboard.
- Confirm that the indicator shows a bearish condition or a recent alert for a pivot break to the downside.
- Open a sell trade after a candle closes below the pivot, checking that there is enough distance to the next support level.
- Remain in the trade while price stays below the pivot and continues to move in the direction of lower support zones.
Stop Loss
- For buy trades, place the stop loss below technical support level that aligns with S1 or a recent swing low.
- For sell trades, place the stop loss above technical resistance level that aligns with R1 or a recent swing high.
- Avoid placing stops too close to the pivot, as price may retest the level before continuing in the trend direction.
Take Profit
- For buy positions, use the next resistance levels such as R1, R2, or R3 as logical take profit targets.
- For sell positions, target the next support levels such as S1, S2, or S3 for partial or full exits.
- In strong trends, you can scale out at each pivot level while keeping a portion of the position open for extended moves.
Multi Pair Pivot Point Scanner MT5 + Speed Oscillator Scalping Strategy
This strategy combines the Multi Pair Pivot Point Scanner indicator with the Speed Oscillator indicator to create a fast and structured scalping approach.
The pivot point acts as a key reference level for market direction.
When price trades above the pivot, it reflects bullish sentiment, while trading below it indicates bearish pressure
This makes it ideal for short term trading where direction needs to be clear before entering a trade.
The Speed Oscillator provides precise timing by showing momentum shifts around the zero level.
A move back above zero signals increasing bullish momentum, while a move below zero reflects growing bearish pressure.
This combination allows traders to align directional bias with momentum confirmation.
The strategy is designed for M1 and M5 charts and works well on pairs like EURJPY, AUDUSD, and USDCAD where short bursts of movement occur frequently.
Buy Entry Rules
- Wait for price to be clearly above the pivot level indicating bullish conditions.
- Watch for the Speed Oscillator to cross back above the zero line.
- Enter a buy trade at the opening of the next candle.
- Place a stop loss below the pivot level or below the most recent micro support.
- Close the trade when the Speed Oscillator crosses back below zero or when price falls below the pivot.
Sell Entry Rules
- Wait for price to be clearly below the pivot level indicating bearish conditions.
- Watch for the Speed Oscillator to cross back below the zero line.
- Enter a sell trade at the opening of the next candle.
- Place the stop loss above the pivot level or above the most recent micro resistance.
- Close the trade when the Speed Oscillator crosses back above zero or when price moves above the pivot.
Case Study 1
On the EURJPY M5 timeframe, price moved above the pivot level after a short consolidation, establishing a bullish bias.
Shortly after, the Speed Oscillator crossed above the zero line, confirming upward momentum.
A buy trade was entered at the next candle open.
Price continued rising with steady momentum while remaining above the pivot.
Around 40 minutes later, the Speed Oscillator crossed back below zero, signaling weakening momentum, and the trade was closed.
Case Study 2
On the AUDUSD M1 timeframe, price dropped below the pivot level, indicating bearish conditions.
Soon after, the Speed Oscillator crossed below the zero line, confirming selling pressure.
A sell trade was entered at the next candle open. Price moved lower in a quick burst.
About 10 minutes later, price moved back toward the pivot while the oscillator started to rise, and the trade was closed as bearish momentum faded.
Download Now
Multi_Pair_Pivot_Point_Scanner_Alerts_v2.8.mq5 Indicator (MT5)
FAQ
How does the Multi Pair Pivot Point Scanner show trend direction?
The scanner highlights whether each currency pair is trading above or below its current pivot point.
A pair above the pivot is treated as bullish, while a pair below the pivot is treated as bearish.
Can I choose which symbols the scanner monitors?
Yes, the indicator lets you define which symbols to scan through its input settings.
What alert options are available in this indicator?
The Multi Pair Pivot Point Scanner Alerts V2.8 Indicator provides several alert modes for pivot interactions.
You can enable popup alerts on your MT5 terminal, push notifications to your mobile device, and email alerts based on pivot crosses or bounce conditions.
How can I filter out weak pivot signals?
The indicator offers bounce settings and an option to use Bollinger Bands as an extra filter.
You can restrict signals to those where price reacts cleanly at a pivot or where volatility conditions match your rules.
Summary
The Multi Pair Pivot Point Scanner Alerts V2.8 Indicator gives you a dashboard view of pivot points, support, and resistance across many currency pairs.
It helps you find trades where price breaks above or below key pivot levels and guides you toward sensible stop and take profit zones.
With flexible alert modes and adjustable inputs, the tool fits both active day traders and more selective swing traders.


