
About the Trendlines LNX Indicator
The Trendlines LNX Indicator for MT4 is a multi-timeframe technical tool designed to automate the process of drawing significant price boundaries across various charts.
It eliminates the manual work of searching for connections between swing highs and lows by instantly projecting lines for the M15, H1, H4, D1, and W1 timeframes.
This provides a comprehensive view of the market, allowing you to see where short-term movements intersect with long-term trends.
Each timeframe is assigned a specific color, which helps you distinguish between local price fluctuations and major institutional levels.
For instance, an hourly resistance line might appear in red while a 15-minute line appears in blue.
By monitoring these levels simultaneously, you can identify high-probability breakout zones where multiple timeframes align.
This tool handles the adjustments dynamically, providing a consistent framework for making objective trading decisions based on pure price action.
Free Download
Download the “trendlines-lnx-indicator.mq4” MT4 indicator
Key Features
- Automates trendline drawing for five different timeframes simultaneously.
- Assigns unique colors to each timeframe for easy identification of support and resistance.
- Prioritizes significant swing points to provide the most relevant market boundaries.
- Updates in real-time to reflect the most recent price action developments.
- Allows for full customization of colors through the indicator input settings.
- Helps traders identify the confluence between short-term entries and long-term trends.
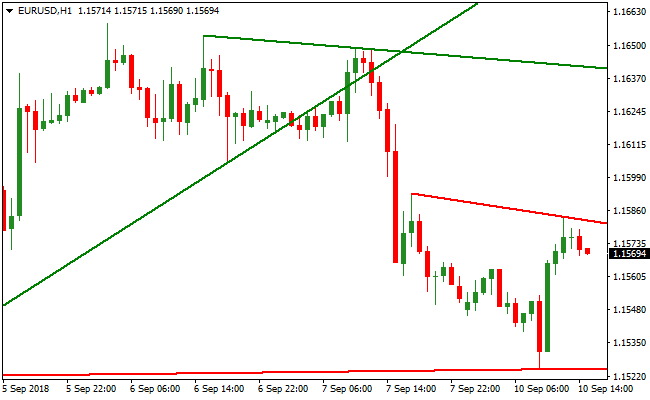
Indicator Chart
The chart below shows the price interacting with these automated boundaries, specifically highlighting how a candle close above or below these levels generates a clear signal for a potential market breakout.
Guide to Trade with Trendlines LNX Indicator
Buy Rules
- Identify the upper resistance line provided by the Trendlines LNX Indicator.
- Wait for the price to move toward the resistance level in an uptrending market.
- Enter a buy trade only when a candle closes firmly above the resistance trendline.
- Ensure the breakout occurs on a timeframe that aligns with your overall trading bias.
Sell Rules
- Identify the lower support line provided by the Trendlines LNX Indicator.
- Wait for the price to move toward the support level in a downtrending market.
- Enter a sell trade only when a candle closes firmly below the support trendline.
- Verify that the momentum supports a continued move lower after the breakout.
Stop Loss
- For long positions, place the stop loss a few pips below the recently broken resistance line.
- For short positions, place the stop loss a few pips above the recently broken support line.
- Alternatively, use the most recent swing high or low as a logical exit point for protection.
Take Profit
- Target the next available trendline identified by the indicator on a higher timeframe.
- Utilize a trailing stop to capture maximum gains during strong trending movements.
- Exit the trade if price shows signs of rejection at a major horizontal level.
MT4 Strategy: TrendLines LNX + SMA Crossover Signal Method
This MT4 strategy combines the TrendLines LNX Indicator and the SMA Crossover Signal Indicator to capture trend continuation moves on lower and medium time frames.
The TrendLines LNX plots dynamic support and resistance lines and signals a buy when price closes above the upper resistance line or a sell when it closes below the lower support line.
The SMA Crossover Signal confirms the trend direction with green arrows for bullish momentum and red arrows for bearish momentum.
This method works well on M5, M15, and H1 charts and is suitable for traders who want precise entries during active market sessions.
By combining the structural break of TrendLines LNX with SMA momentum confirmation, traders avoid false breakouts and enter trades with higher probability setups.
The strategy focuses on following confirmed trend breaks aligned with momentum, making it effective for both scalping and short term swing trades.
It simplifies entry rules while maintaining strong risk management through clear stop loss and take profit placement.
Buy Entry Rules
- Price closes above the upper resistance trend line of TrendLines LNX.
- A green arrow appears from the SMA Crossover Signal Indicator.
- No major resistance zone is immediately ahead.
- Place a stop loss below the broken trend line or the nearest swing low.
- Take profit at the next resistance area or a fixed 10 to 25 pip target depending on volatility.
Sell Entry Rules
- Price closes below the lower support trend line of TrendLines LNX.
- A red arrow appears from the SMA Crossover Signal Indicator.
- No strong support level is immediately ahead.
- Place a stop loss above the broken trend line or the nearest swing high.
- Take profit at the next support area or a fixed 10 to 25 pip target.
Advantages
- Breakout structure is confirmed by candle closes, reducing false signals.
- SMA Crossover Signal adds trend confirmation to avoid counter trend entries.
- Works well on many pairs and multiple time frames.
- Simple trading rules make it easy to follow for beginners.
- Clear stop loss and take profit zones improve risk management.
Drawbacks
- False breakouts can occur during low liquidity or high volatility spikes.
- Trend shifts may lag slightly on very fast pairs.
- Requires patience to wait for both trend line break and arrow confirmation.
Case Study 1: EURAUD M5
During the London session, EURAUD formed a rising resistance line.
Price closed above the upper TrendLines LNX line and shortly after, a green arrow appeared from the SMA Crossover Signal.
A buy trade was taken with a stop below the broken trend line.
Price continued upward and reached the next intraday resistance, producing a gain of 15 pips.
The combination of trend break and momentum confirmation created a high probability trade.
Case Study 2: NZDCAD M15
NZDCAD was trading along a descending support trend line during the early New York session.
Price closed below the lower TrendLines LNX line and a red arrow appeared from the SMA Crossover Signal shortly after.
A sell trade was executed with a stop above the broken trend line.
The pair moved lower to the next support level for a profit of 20 pips.
Strategy Tips
- Only take trades after a full candle closes beyond the trend line to confirm the breakout.
- Use SMA Crossover arrows as confirmation to filter weak or fake breakouts.
- Focus on London and New York sessions for the most active and reliable moves.
- Avoid trading into strong support or resistance zones without sufficient room for movement.
- Check volatility and spread before entering lower time frame trades to avoid slippage.
- Adjust take profit targets slightly for highly volatile pairs to capture more of the move safely.
Download Now
Download the “trendlines-lnx-indicator.mq4” Metatrader 4 indicator
FAQ
Why are the colors of the lines different on my chart?
The Trendlines LNX Indicator uses a color-coded system to represent different timeframes.
This allows you to immediately recognize whether a line belongs to the 15-minute chart or the daily chart.
You can modify these colors in the settings menu to match your specific chart template preferences.
Which timeframe carries the most importance for signals?
In forex trading, higher timeframe trendlines are generally more reliable.
A breakout on a daily or 4-hour trendline identified by this tool is often more significant than a breakout on a 15-minute line.
It is best to use lower timeframe entries in the direction of the higher timeframe trend.
Can this indicator be used for scalping?
Yes, the Trendlines LNX Indicator is highly effective for scalping when focusing on the M15 lines.
Scalpers can look for quick breakouts of these levels while using the H1 or H4 lines to ensure they are not trading directly into a major zone of institutional resistance.
Summary
The Trendlines LNX Indicator is a versatile asset for any trader who relies on structural analysis.
Automating the detection of trendlines across multiple timeframes provides a level of perspective that is difficult to achieve with manual drawing alone.
The primary benefit of this tool is its ability to highlight the hierarchy of market levels, ensuring you never lose sight of the bigger picture while looking for intraday entries.
For best results, focus on breakouts that occur with strong candle closes and align with the prevailing trend on higher timeframes.


