About the Trend Lines Day Indicator
The Trend Lines Day Indicator for MT4 is a specialized technical tool designed to automate the identification of critical price action boundaries.
This tool focuses on the two most significant trend lines currently affecting price movement.
It acts as a dynamic filter that identifies where the market is likely to compress before a major breakout occurs.
It identifies recent swing highs and lows to plot resistance and support lines that adapt as new data points emerge.
This helps traders stay on the right side of the market by providing a definitive boundary for bullish and bearish sentiment.
By using the Trend Lines Day Indicator, you remove the subjectivity often associated with manual drawing, ensuring that your entry points are based on consistent mathematical parameters.
Free Download
Download the “trendlinesday-indicator.ex4” MT4 indicator
Key Features
- Automatically identifies and draws the most relevant support and resistance lines.
- Uses a color-coded system to distinguish between bullish and bearish breakout zones.
- Updates in real-time as the market forms new swing points.
- Focuses on high-probability breakout zones for both long and short positions.
Indicator Chart
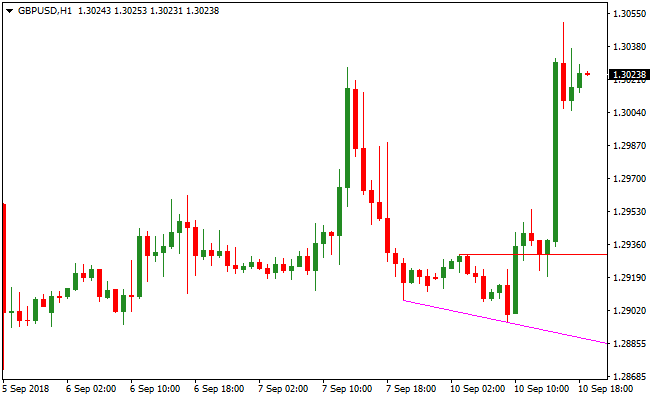
The Trend Lines Day Indicator is displayed on the GBP/USD H1 chart, highlighting the red resistance line and the magenta support line.
The chart shows how price reacts at these specific levels and provides a signal once a candle closes outside the established trend channel.

Guide to Trade with Trend Lines Day Indicator
Buy Rules
- Wait for the price to approach the red resistance trend line.
- Observe a candle break and close completely above the red line.
- Enter a long position at the opening of the next candle.
- Confirm that the breakout candle shows strong momentum.
Sell Rules
- Wait for the price to approach the magenta support trend line.
- Observe a candle break and close completely below the magenta line.
- Enter a short position at the opening of the next candle.
- Ensure the candle close is decisive to avoid false breakouts.
Stop Loss
- For buy trades, place the stop loss 1-3 pips below the most recent support level.
- For sell trades, place the stop loss 1-3 pips above the most recent resistance level.
- Adjust the stop loss to breakeven once the price moves in your favor.
Take Profit
- Set the take profit at the next major horizontal resistance or support level.
- Use a fixed risk-to-reward ratio of at least 1:2.
- Exit the trade if an opposing breakout signal occurs.
MT4 Strategy: Trend Lines Day + Super Arrow Lower Time Frame Method
This MT4 strategy uses the Trend Lines Day Indicator and the Super Arrow Indicator to capture fast breakout moves on lower time frames.
It works best on M1, M5, and M15 charts where price often reacts quickly after breaking key trend lines.
The Trend Lines Day Indicator plots dynamic support and resistance trend lines, and a breakout with a candle close confirms the direction.
The Super Arrow Indicator then adds momentum confirmation using green arrows for bullish movement and red arrows for bearish pressure.
This combination helps traders avoid early or false breakouts by requiring both a confirmed break and a trend aligned arrow.
It also keeps charts clean and efficient, which is ideal for fast paced lower time frame trading.
The method suits beginners who want simple visual rules and experienced scalpers who want consistent breakout entries.
The strategy focuses on trading in the direction of fresh momentum after the market breaks a trend boundary.
This creates strong follow through opportunities while reducing the noise often found on smaller charts.
Buy Entry Rules
- Price breaks and closes above the resistance trend line.
- A green arrow from the Super Arrow Indicator appears shortly after the breakout.
- No major resistance level is directly ahead.
- Place a stop loss below the broken trend line or the nearest swing low.
- Take profit at the next resistance zone or use a fixed 10 to 20 pip target depending on volatility.
Sell Entry Rules
- Price breaks and closes below the support trend line.
- A red arrow from the Super Arrow Indicator appears after the breakout.
- No major support level is directly ahead.
- Place a stop loss above the broken trend line or the nearest swing high.
- Take profit at the next support zone or a fixed 10 to 20 pip target.
Advantages
- Breakouts are confirmed by candle closes which reduces false signals.
- Super Arrow confirmation filters out weak or early entries.
- Clean and simple rules suitable for lower time frame traders.
- Works well on most major and cross pairs.
- Can generate multiple setups per session.
Drawbacks
- False breakouts can still occur in very volatile conditions.
- Trend lines need time to form, so not every session will provide signals.
- News spikes can break lines without creating a stable follow through.
Case Study 1: EURJPY M5
During the London session, EURJPY formed a rising diagonal resistance line.
Price eventually broke above the line and closed strongly.
Within the next few candles, a green arrow appeared which confirmed fresh bullish momentum.
A buy trade was taken with a stop below the broken trend line. EURJPY continued higher and reached the next intraday resistance, producing a gain of around 18 pips.
The smooth breakout combined with the arrow confirmation made this a high probability setup.
Case Study 2: AUDCAD M15
AUDCAD built a descending support trend line during the Asian session.
Later, price broke and closed below the support line.
A red arrow appeared shortly after, confirming bearish continuation.
A sell trade was executed with a stop placed above the broken trend line.
The pair moved lower and touched the next support area for a profit of 22 pips.
Strategy Tips
- Only trade breakouts when the candle fully closes beyond the trend line. Wicks alone are not reliable.
- Use the Super Arrow as confirmation. Breakouts without arrows often lack momentum.
- Trade mainly during London and New York sessions where volatility supports strong breakouts.
- Avoid entries that form directly into recent support or resistance. Give the price room to move.
- Red news events can cause fake breakouts, so avoid trading during those moments.
- On fast pairs like GBPJPY, consider securing partial profits earlier to lock in gains.
Download Now
Download the “trendlinesday-indicator.ex4” Metatrader 4 indicator
FAQ
Does the Trend Lines Day Indicator repaint its lines?
This tool adjusts its lines based on new swing highs and lows.
Once a breakout is confirmed by a candle close, the entry point remains valid for that specific trade setup.
Can I change the colors of the support and resistance lines?
Yes, you can customize the colors in the settings menu of the Trend Lines Day Indicator.
By default, it uses red for resistance and magenta for support to help you quickly identify which direction the market is breaking.
How does this indicator handle sideways or ranging markets?
During a range, the lines will appear closer together, forming a channel.
The indicator is designed to wait for the price to exit this range.
You should only take a trade when a candle closes outside the channel, which helps avoid being caught in whipsaw movements during consolidation.
Summary
The Trend Lines Day Indicator is a robust solution for traders who prioritize price action and breakout strategies.
The primary benefit of the tool is the clarity it brings to the chart, allowing you to focus on price movement rather than manual analysis.
While it is highly effective on its own, pairing it with volume analysis or a momentum oscillator can further refine your entries.
Overall, it is a versatile tool that enhances the workflow of any MT4 user looking to trade breakouts with more precision.


