
About the Multi Timeframes Support & Resistance Indicator
The Multi Timeframes Support & Resistance indicator is a practical tool for spotting critical price levels across multiple timeframes on a single chart.
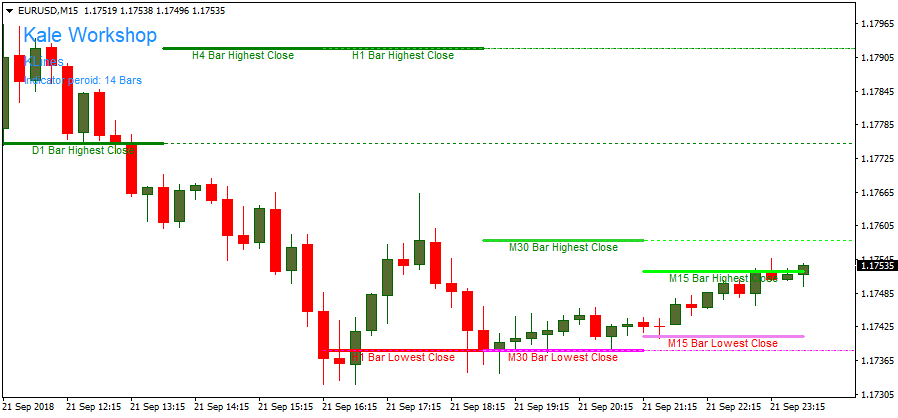
The indicator for MT4 displays the highest and lowest bar close prices from selected timeframes, including M1, M5, M30, H1, H4, and D1.
This helps traders identify strong support and resistance levels without switching charts.
By visualizing multiple timeframes simultaneously, it becomes easier to see where price may reverse or break out.
Traders can use this to plan entries, exits, and stop-loss placement with more confidence.
The indicator is suitable for scalping, day trading, and swing trading, as it provides clear zones where price is likely to react.
It also improves trade management by highlighting key levels for taking profits or cutting losses.
Free Download
Download the “klines-indicator.mq4” MT4 indicator
Key Features
- Displays support and resistance from multiple timeframes on one chart.
- Supports M1, M5, M30, H1, H4, and D1.
- Helps identify breakout and reversal zones quickly.
- Assists in placing stop-loss orders below support or above resistance.
- Provides visual cues for potential take-profit levels.
- Reduces the need to check multiple charts manually.
Indicator Chart
The chart illustrates the Multi Timeframes Support & Resistance indicator applied to a trending market.
Horizontal lines show key support and resistance levels from multiple timeframes.
Traders can spot breakout opportunities, plan trade entries, and define stop-loss and take-profit levels in seconds.
Guide to Trade with the Multi Timeframes Support & Resistance Indicator
Buy Rules
- Wait for the price to break and close above a resistance line.
- Confirm the breakout with a strong bullish candle.
- Ensure the higher timeframe trend supports the breakout.
- Open a buy trade at the next candle open.
Sell Rules
- Wait for the price to break and close below a support line.
- Confirm the breakout with a strong bearish candle.
- Ensure the higher timeframe trend supports the downward move.
- Enter a sell trade at the next candle open.
Stop Loss
- Place the stop loss just below the broken support for buy trades.
- Place the stop loss just above the broken resistance for sell trades.
- Adjust stops based on volatility and timeframe.
- Move the stop to breakeven after the trade progresses favorably.
Take Profit
- For buy trades, close the position as price approaches the next resistance level.
- For sell trades, close the position as price approaches the next support level.
- Consider partial profit-taking before strong multi-timeframe zones.
- Trail stops along support/resistance to lock in profits.
Multi-Timeframe Support/Resistance + Wolfe Wave MT4 Trading Strategy
This MT4 trading strategy combines two highly complementary tools: the Multi-Timeframes Support & Resistance Indicator for MT4 and the Wolfe Wave Indicator for MT4.
The support and resistance indicator automatically plots the highest closing prices as resistance and the lowest closing prices as support across multiple timeframes, including M1, M5, M30, H1, H4, and D1.
This gives a clear and objective view of the most important levels the market is watching.
The Wolfe Wave indicator adds structure by identifying natural wave formations that often signal price exhaustion or the start of a reversal.
When point 5 of a Wolfe Wave forms directly at or near a higher timeframe support or resistance level, the probability of a clean turning point increases.
This combination is ideal for day traders and swing traders using M30, H1, and H4 charts who want precise entries based on market structure rather than noisy intraday signals.
The strategy works because it aligns three elements at once: a major level from a higher timeframe, a geometric wave pattern suggesting price imbalance, and a candle confirmation that shows rejection from the zone.
By trading only when these factors overlap, the method focuses on fewer but higher-quality setups.
It is suitable for traders who prefer structured, disciplined entries without relying on a complex indicator stack.
Buy Entry Rules
- Price approaches or reacts to a support level created by the Multi-Timeframes Support & Resistance indicator.
- A bullish Wolfe Wave completes with point 5 forming near or slightly below the support zone.
- Enter a buy trade after the candle forming point 5 closes and confirms rejection from support.
- Place a stop loss a few pips below the low of point 5 or just under the support zone.
- Take profit at the Wolfe Wave target line drawn from point 1 to point 4, or at the next major resistance level.
Sell Entry Rules
- Price approaches or rejects a resistance level created by the Multi-Timeframes Support & Resistance indicator.
- A bearish Wolfe Wave completes with point 5 forming near or slightly above the resistance zone.
- Enter a sell trade after the candle forming point 5 closes and confirms rejection from resistance.
- Place a stop loss a few pips above the high of point 5 or just above the resistance zone.
- Take profit at the Wolfe Wave target line from point 1 to point 4, or near the next support level.
Advantages
- Uses higher timeframe support and resistance for more reliable turning points.
- Wolfe Wave patterns add precise structure, making entries more disciplined and less emotional.
- Filters out many low-quality trades by requiring level, pattern, and candle confirmation.
- Works on several timeframes, giving both intraday and swing opportunities.
- Provides clear entry, stop, and exit rules without relying on arbitrary parameters.
Drawbacks
- Valid Wolfe Wave setups are not frequent, so trade opportunities are limited.
- Pattern identification requires some practice and attention to proper wave structure.
- Strong news releases can break patterns and invalidate zones quickly.
- Weak or newly formed support/resistance lines may not hold, reducing reliability.
- Patience is required, as forced trades usually result in losses.
Example Case Study 1
On EURUSD H1, a strong H4 support zone was marked around 1.0850 by the Multi-Timeframes Support & Resistance indicator.
As price dipped into this level, a bullish Wolfe Wave formed with point 5 touching the support area.
The point 5 candle closed with a long wick showing rejection.
A buy order was placed at 1.0862.
The stop loss was positioned 8 pips below the point 5 low.
The target line from point 1 through point 4 projected near 1.0940, which aligned with a known resistance zone.
Over the next hours, price rallied steadily and reached the target.
The trade closed at 1.0938 for a gain of approximately 78 pips.
Example Case Study 2
On GBPUSD M30 during the London session, the indicator showed a strong H1 resistance zone at 1.2630.
Price pushed into this level and formed a bearish Wolfe Wave pattern.
Point 5 spiked slightly above the zone before closing with a bearish pin bar.
A sell trade was taken at 1.2633 with a stop loss 10 pips above the point 5 high.
The Wolfe Wave target line pointed down toward the 1.2550 support level.
Price moved lower throughout the session and eventually reached the target area.
The trade was closed at 1.2556 for a profit of about 77 pips.
Strategy Tips
- Use the H4 or H1 levels as your primary zones; they tend to produce the strongest reactions.
- Do not enter before point 5 completes; early entries usually fail.
- Look for strong wick rejection at point 5 to confirm the pattern.
- Avoid trading during major economic releases to prevent pattern failure.
- Journal every Wolfe Wave setup to improve pattern recognition over time.
- Only take trades when both the pattern and the higher timeframe zone align.
- Skipping weak setups increases long-term consistency.
Download Now
Download the “klines-indicator.mq4” Metatrader 4 indicator
FAQ
Which timeframes are supported by this indicator?
It supports M1, M5, M30, H1, H4, and D1, displaying key levels from each timeframe on a single chart.
Can it be used for scalping?
Yes, it works well on lower timeframes, especially when combined with price action confirmation.
How can I use this indicator to manage trades?
Use the support and resistance lines to place stop-loss orders, set take-profit targets, or identify breakout points.
Does it repaint or change past levels?
No, the indicator plots levels based on completed bars, ensuring reliable reference points for trading decisions.
Summary
The Multi Timeframes Support & Resistance indicator simplifies market analysis by showing critical levels across multiple timeframes on a single chart.
It helps traders spot breakouts, reversals, and plan entries, stop-loss, and take-profit points efficiently.


