
About the Absolute Strength Histogram Indicator
The Absolute Strength Histogram indicator for MT4 shows trend strength using colored histogram bars in a separate window.
Green bars indicate bullish momentum, and red bars indicate bearish momentum.
The indicator combines trend strength with a moving average to produce reliable buy and sell signals.
Use it with a trend-following tool, like a 100-period SMA, to filter trades and avoid trading against the main trend.
The default settings can be adjusted to match your preferred trading style and timeframe.
Free Download
Download the “absolute-strength-histogram.mq4” MT4 indicator
Key Features
- Displays buy/sell histogram bars in a separate MT4 window.
- Green bars indicate a bullish trend, red bars indicate a bearish trend.
- Combines trend strength with a moving average for more reliable signals.
- Works with any trend-following tool to filter trades.
- Adjustable settings to fit scalping, day trading, or swing trading.
Indicator Chart
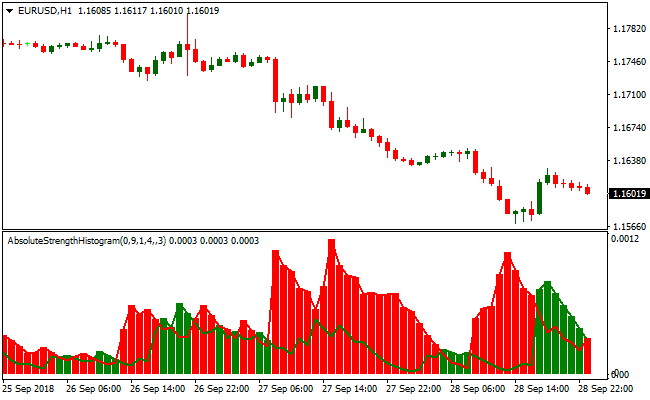
The chart shows green and red histogram bars indicating bullish or bearish momentum.
Green bars suggest long trade opportunities, red bars suggest short trade opportunities.
Traders can quickly identify the prevailing trend and potential entry points.
Guide to Trade with Absolute Strength Histogram
Buy Rules
- Open a buy trade when the histogram changes from red to green.
- Confirm the trend is upward with a trend-following indicator or moving average.
- Focus on entries aligned with the main trend.
- Avoid buying if the overall trend is downward.
Sell Rules
- Open a sell trade when the histogram changes from green to red.
- Confirm the trend is downward with a trend-following indicator or moving average.
- Focus on entries aligned with the main trend.
- Avoid selling if the overall trend is upward.
Stop Loss
- For buy trades, place the stop slightly below the most recent green histogram bar or swing low.
- For sell trades, place the stop slightly above the most recent red histogram bar or swing high.
- Alternatively, use the last opposite color histogram bar as a reference for your stop.
Take Profit
- Close buy trades when red histogram bars appear.
- Close sell trades when green histogram bars appear.
- Optionally, close your open trades when your chosen risk-reward ratio is met.
Absolute Strength Indicator + ZeroLag MACD Forex Scalping Strategy MT4
This scalping strategy combines the Absolute Strength Histogram MT4 Indicator and the ZeroLag MACD MT4 Indicator to provide a fast and efficient method for day trading.
The Absolute Strength Histogram measures short-term momentum, showing green bars for bullish momentum and red bars for bearish momentum.
The ZeroLag MACD confirms the overall trend by indicating whether price action is above or below the zero line.
By combining these two indicators, traders can identify high-probability entry points where momentum and trend align.
This strategy is particularly effective on short timeframes such as M1, M5, and M15, making it ideal for scalpers who aim to capture small, quick profits multiple times per day.
It works best on major currency pairs with high liquidity, as price moves more reliably and spreads are tighter.
By focusing on momentum and trend alignment, the strategy helps reduce false entries and increases the chance of successful scalping trades.
Buy Entry Rules
- Open a buy trade when the Absolute Strength Histogram shows green bars.
- Confirm that the ZeroLag MACD value is above zero.
- Enter the trade at the next candle close when both conditions are met.
- Set the stop loss below the recent swing low or just under a nearby support level.
- Take profit when the Absolute Strength Histogram shows a red reversal bar.
Sell Entry Rules
- Open a sell trade when the Absolute Strength Histogram shows red bars.
- Confirm that the ZeroLag MACD value is below zero.
- Enter the trade at the next candle close when both conditions are met.
- Set the stop loss above the recent swing high or just above a nearby resistance level.
- Take profit when the Absolute Strength Histogram displays a green reversal bar.
Advantages
- Fast signals allow capturing small, quick market movements suitable for scalping.
- Combining momentum and trend indicators reduces false entries compared to using a single indicator.
- Works on multiple short timeframes, giving traders flexibility to trade M1, M5, or M15 charts.
- Dynamic take profit and stop loss based on price levels allow adaptive exits depending on market conditions.
- Simple rules make it easy for beginners to follow while still being effective for experienced traders.
- Helps identify both momentum and trend reversals, improving scalp timing accuracy.
Drawbacks
- Frequent trades can increase costs due to spreads and possible slippage.
- Requires constant attention and fast reactions, making it unsuitable for casual traders.
- Signals may be less reliable during low volatility or quiet sessions.
- Short timeframes can produce noise, requiring discipline to avoid overtrading.
- Success depends heavily on timing the entry and exit accurately.
- Not ideal for accounts with very high spreads or slow execution brokers.
Case Study 1: EUR/JPY on M5
On the 5-minute EUR/JPY chart, the Absolute Strength Histogram turned green while the ZeroLag MACD value was above zero.
A buy trade was entered at 148.50 with a stop loss at 148.40.
The price moved steadily upward and reached 148.70, capturing a profit of 20 pips before the histogram bars began to fade and the MACD approached zero.
Case Study 2: AUD/USD on M1
On the 1-minute AUD/USD chart, red histogram bars appeared on the Absolute Strength Histogram and the ZeroLag MACD value dropped below zero.
A sell trade was opened at 0.6705 with a stop loss at 0.6710.
The price moved down to 0.6698, giving a gain of 7 pips before the histogram started turning green and the MACD approached zero.
Additional Strategy Tips
- Combine signals with higher timeframe trend analysis to avoid trading against the overall market direction.
- Wait for small pullbacks toward the SuperTrend or support/resistance levels before entering trades to improve timing.
- Limit scalping trades to the most volatile periods of the day to maximize pip potential.
- Use alerts on your indicators to avoid constantly watching the chart and catch setups immediately.
- Adjust stop loss and take profit levels dynamically depending on pair volatility and recent market swings.
- Keep position sizes small to manage risk, since scalping trades are frequent and tight.
- Focus on major currency pairs and avoid exotic pairs where spreads are high and liquidity is low.
- Record each trade in a journal with time, pair, entry, exit, and pip gain/loss to monitor performance and optimize the strategy.
- Combine with other simple confirmations such as candlestick patterns to improve the accuracy of entries.
- Practice discipline and avoid overtrading, only taking trades that meet all entry criteria from both indicators.
Download Now
Download the “absolute-strength-histogram.mq4” Metatrader 4 indicator
FAQ
How does the histogram indicate trend strength?
Green bars indicate upward momentum and red bars indicate downward momentum. The taller the bars, the stronger the trend.
Can it be used alone?
While it can be used standalone, combining it with a trend-following tool like an SMA improves trade reliability.
Can the indicator settings be adjusted?
Yes, all default settings can be modified in the inputs tab to fit your preferred strategy and market conditions.
Summary
The Absolute Strength Histogram indicator for MT4 provides Forex traders with a clear view of market momentum using colored histogram bars.
Green and red bars highlight bullish and bearish trends, helping align trades with the main trend.
This indicator is ideal for quickly spotting trend changes and timing entries.
Combined with a trend-following indicator, it enhances trade accuracy and allows traders to manage risk effectively.


