About the All CCI Dashboard Indicator
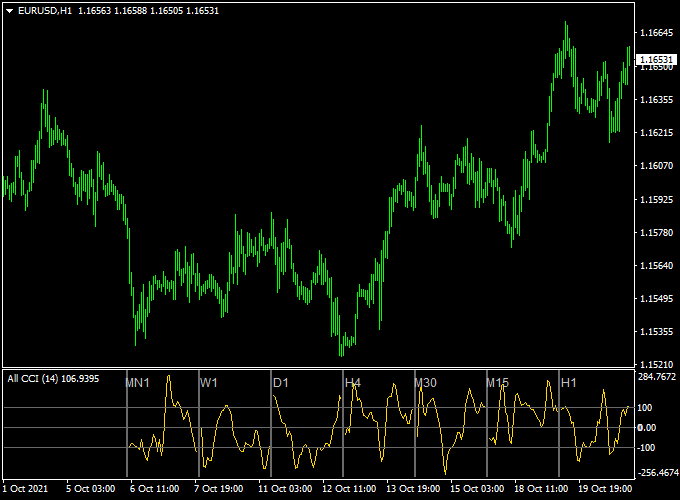
The All CCI Dashboard indicator for MT4 shows Commodity Channel Index (CCI) values across 7 different timeframes: 15-minute, 30-minute, 1-hour, 4-hour, daily, weekly, and monthly.
CCI, developed by Donald Lambert, helps identify overbought and oversold conditions and is widely used in many trading strategies.
CCI readings above +100 may signal the start of a bullish trend, while readings below -100 may indicate a bearish trend.
By viewing multiple timeframes in a single dashboard, you can quickly gauge market momentum and potential entry opportunities.
For best results, use the dashboard alongside a trend-following indicator.
In an upward trend, focus on CCI movements back above +100 and ignore signals below -100.
In a downward trend, focus on CCI movements back below -100 and ignore signals above +100.
The default period is 14, but you can adjust it according to your trading style.
Free Download
Download the “all-cci-indicator.mq4” MT4 indicator
Key Features
- Displays CCI readings for 7 timeframes in a single dashboard.
- Highlights overbought (+100) and oversold (-100) conditions.
- Supports 15-minute, 30-minute, 1-hour, 4-hour, daily, weekly, and monthly charts.
- Quickly shows overall market momentum and trend alignment.
- Helps spot high-probability trade setups across multiple timeframes.
Indicator Chart
The All CCI Dashboard chart shows multiple histograms representing CCI levels on each timeframe.
Blue histograms indicate bullish momentum (+100 zone), while red histograms indicate bearish momentum (-100 zone).
This allows you to quickly assess trend strength and potential entry points.

Guide to Trade with the All CCI Dashboard Indicator
Buy Rules
- Ensure the overall trend is upward using a trend-following indicator.
- Wait for CCI to move back above +100 on your selected timeframe.
- Open a buy trade when the signal aligns with the trend direction.
- Ignore buy signals if the overall trend is downward.
Sell Rules
- Ensure the overall trend is downward using a trend-following indicator.
- Wait for CCI to move back below -100 on your selected timeframe.
- Open a sell trade when the signal aligns with the trend direction.
- Ignore sell signals if the overall trend is upward.
Stop Loss
- Move the stop based on recent price swings.
- Place the stop where it protects the trade from normal fluctuations.
- Adjust the stop to match your trading style and risk tolerance.
Take Profit
- Close buy trades when CCI drops back below +100 on the trading timeframe.
- Close sell trades when CCI rises back above -100 on the trading timeframe.
- Optionally, set a fixed profit target based on your preferred risk-reward ratio.
All CCI Dashboard + Winner Trend Bars MT4 Scalping Strategy
This MT4 scalping strategy combines the All CCI Dashboard MT4 indicator and the Winner Trend Bars MT4 indicator.
The All CCI Dashboard gives buy signals when the CCI surges back above +100 from below and sell signals when it plunges below –100 from above.
The Winner Trend Bars indicator helps confirm trend direction: green bars indicate a bullish trend and red bars indicate a bearish trend.
Combining these indicators allows traders to scalp trades with momentum and trend confirmation, improving the probability of success.
Optimized for scalping on M5 and M15 charts and works well with a wide range of currency pairs.
Buy Entry Rules
- The All CCI Dashboard crosses back above +100, signaling strong bullish momentum.
- The Winner Trend Bars display green bars, confirming a bullish trend.
- Enter a long trade immediately after both conditions are met.
- Place a stop loss a few pips below the recent swing low.
- Take profit when either the bars turn red or the CCI drops below +100, or near a nearby resistance level.
Sell Entry Rules
- The All CCI Dashboard crosses back below –100, signaling strong bearish momentum.
- The Winner Trend Bars display red bars, confirming a bearish trend.
- Enter a short trade immediately after both conditions are met.
- Set stop loss a few pips above the recent swing high.
- Close the trade when bars turn green, CCI rises above –100, or near a support zone.
Advantages
- Combines strong momentum signals from CCI with trend confirmation for higher probability trades.
- Helps avoid false entries by ensuring both momentum and trend align before entering.
- Works on multiple currency pairs, including majors and crosses, allowing flexibility for traders.
- Clear entry and exit rules make it easy to follow for both beginners and experienced traders.
- Allows dynamic trade management using price action instead of fixed pip targets.
- Quick setups suitable for scalping sessions, taking advantage of short-term market moves.
- Can be used across different sessions, providing multiple trading opportunities per day.
Drawbacks
- Requires constant attention and quick execution to capture short-term moves.
- CCI signals can occasionally lag during very fast trend changes, causing missed entries.
- Trade opportunities may be limited if indicators are not aligned frequently enough.
- High spread or low liquidity pairs may reduce net profit from short-term scalps.
Case Study 1 (EURUSD M5 bullish scalp)
During the London session on EURUSD M5, the All CCI Dashboard surged back above +100 after a brief pullback, indicating strong bullish momentum.
At the same time, the Winner Trend Bars displayed green bars, confirming that the overall trend was bullish.
A buy trade was entered at 1.1008 with a stop loss placed at 1.0995, just below the recent swing low.
Price moved steadily upward as buying pressure increased, reaching the first resistance zone around 1.1025.
After a short consolidation, the trade continued to climb, and the bars turned red at 1.1030, signaling it was time to exit.
This trade captured 22 pips.
Case Study 2 (USDJPY M5 bearish scalp)
On USDJPY M5 during an early New York session, the All CCI Dashboard plunged below –100, signaling strong bearish momentum after a minor retracement.
Simultaneously, the Winner Trend Bars showed red bars, confirming the bearish trend.
A short trade was opened at 155.45 with a stop loss at 155.70, just above the recent swing high.
The price quickly dropped as sellers dominated, reaching the first minor support at 155.25.
Momentum remained strong and the trade extended to 155.10 before the CCI started to rise above –100, and the bars indicated a potential reversal.
Exiting at this point captured 35 pips.
Strategy Tips
- Focus on high-volume sessions to take advantage of stronger momentum and smoother trends.
- Only enter trades when both the CCI signal and the trend bars are clearly aligned.
- Check higher timeframes before entering to ensure the trade aligns with the overall market trend.
- Use tight but sensible stop losses based on recent swings to minimize losses in volatile conditions.
- Consider taking partial profits at nearby support or resistance levels and trail stops on the remaining position.
- Monitor multiple currency pairs but focus on the ones that show clear trend and momentum signals for the day.
- Keep a trading journal to track setups, results, and market conditions to refine the strategy over time.
- Practice patience and discipline, waiting for clean setups rather than forcing trades.
Download Now
Download the “all-cci-indicator.mq4” Metatrader 4 indicator
FAQ
Can this indicator be used on all currency pairs?
Yes, it works across all forex pairs, as well as stocks, indices, or other instruments.
What if CCI signals are mixed across timeframes?
If some timeframes are above +100 and others below -100, focus on signals that match the dominant trend to increase probability.
Do I need a trend-following indicator?
While CCI can provide signals alone, combining it with a trend indicator improves reliability and helps avoid false entries in trending markets.
Can I adjust the CCI period?
Yes, the default period is 14, but you can change it in the inputs tab to suit your strategy.
Summary
The All CCI Dashboard indicator for MT4 gives Forex traders a clear multi-timeframe view of CCI momentum.
Overbought and oversold signals are displayed in an easy-to-read dashboard, allowing quick assessment of potential trade opportunities.
This tool is ideal for monitoring market conditions without opening multiple charts.
By combining CCI signals with trend direction, users can spot strong trends, identify reversals early, and manage entries and exits effectively.


