About the All ADX Dashboard Indicator
The All ADX Dashboard indicator for MT4 shows ADX (Average Directional Index) across 7 timeframes: 15-minute, 30-minute, 1-hour, 4-hour, daily, weekly, and monthly.
ADX, developed by J. Welles Wilder, measures trend strength and helps identify potential trend changes.
The indicator includes three components: DI+ (green line), DI- (red line), and the ADX trend strength line (yellow line).
Crossovers between DI+ and DI- provide simple buy or sell signals.
The dashboard allows you to monitor multiple timeframes at a glance, helping to confirm trend alignment before entering a trade.
The default period is 14, but it can be adjusted in the inputs tab.
For best results, use the dashboard with other technical tools to validate signals.
Free Download
Download the “all-adx-indicator.mq4” MT4 indicator
Key Features
- Displays ADX readings for 7 timeframes in a single dashboard.
- Shows DI+ (green), DI- (red), and trend strength (yellow) lines.
- Highlights bullish and bearish crossover signals.
- Helps identify strong trends across multiple timeframes quickly.
- Adjustable ADX period to match your strategy.
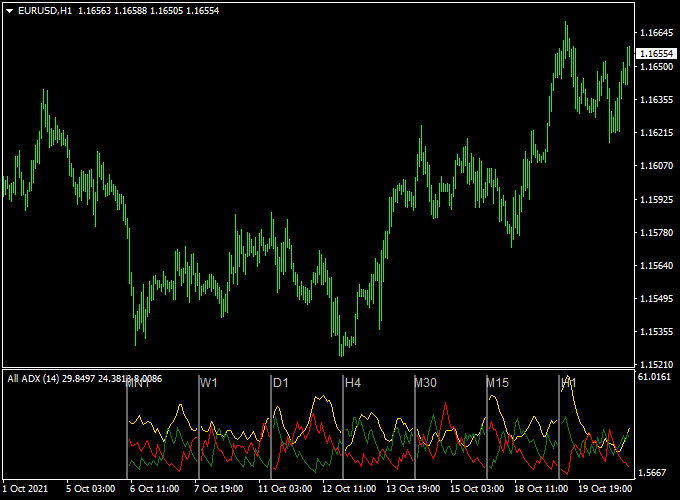
Indicator Chart
The All ADX Dashboard chart shows DI+ and DI- crossovers for each timeframe.
Green crossovers indicate potential buy opportunities, and red crossovers indicate potential sell opportunities.
The ADX line shows trend strength, allowing you to focus on strong and reliable trends.

Guide to Trade with the All ADX Dashboard Indicator
Buy Rules
- Ensure the overall trend is up using the ADX strength line.
- Open a buy trade when DI+ crosses above DI- on your selected timeframe.
- Confirm trend alignment across multiple timeframes if possible.
- Ignore buy signals if DI- is consistently above DI+ or the trend is weak.
Sell Rules
- Ensure the overall trend is down using the ADX strength line.
- Open a sell trade when DI- crosses above DI+ on your selected timeframe.
- Confirm trend alignment across multiple timeframes if possible.
- Ignore sell signals if DI+ is consistently above DI- or the trend is weak.
Stop Loss
- For buy trades, place the stop just below the recent minor support or consolidation area.
- For sell trades, place the stop just above the recent minor resistance or consolidation area.
- Adjust the stop to suit your preferred risk level.
Take Profit
- Close buy trades when DI- crosses above DI+ or the trend weakens.
- Close sell trades when DI+ crosses above DI- or the trend weakens.
- Optionally, set a fixed profit target based on your risk-reward ratio.
All ADX Dashboard + ADX with DeMarker Signals Forex Scalping Strategy
This MT4 scalping strategy combines the All ADX Dashboard MT4 indicator and the ADX with DeMarker Forex Signal MT4 indicator.
The All ADX Dashboard gives trend direction signals.
A bullish setup appears when the green DI+ line crosses above the red DI minus line from below and a bearish setup when the red DI minus line crosses above the green DI+ line from below.
The ADX with DeMarker indicator adds a second confirmation using colored arrows: green arrows for a bullish trend and red arrows for a bearish trend.
This combination is ideal for fast execution on M1 and M5 charts, helping scalpers catch quick moves with trend confirmation and momentum.
Buy Entry Rules
- On the All ADX Dashboard, the green DI+ line crosses above the red DI minus line, indicating bullish trend bias.
- The ADX with DeMarker indicator displays a green arrow, confirming bullish momentum.
- Enter a long trade immediately after the candle closes with both conditions met.
- Place a stop loss a few pips below the recent swing low or the entry candle’s low.
- Take profit when either the arrows turn red or DI minus crosses back above DI+, or near a nearby resistance level.
Sell Entry Rules
- On the All ADX Dashboard, the red DI minus line crosses above the green DI+ line, signaling bearish trend bias.
- The ADX with DeMarker indicator displays a red arrow, confirming bearish momentum.
- Enter a short trade immediately after the candle closes with both conditions satisfied.
- Set the stop loss a few pips above the recent swing high or above the entry candle’s high.
- Target a modest pip gain or exit when a green arrow appears or DI+ crosses back above DI minus.
Advantages
- Combines trend direction signals with momentum confirmation to reduce false scalping entries.
- Works well on very short timeframes allowing multiple trading opportunities per day.
- Clear entry rules make it simple to implement under fast market conditions.
- Small profit targets allow quick exits, useful in volatile sessions.
- Suitable for many major and cross FX pairs with sufficient liquidity.
Drawbacks
- DI lines and arrows can occasionally give false signals in choppy conditions.
- Small pip targets mean that spread or slippage can reduce profits if execution is not precise.
Example Case Study 1 (EURUSD M1 bullish scalp)
During the London session on EURUSD M1, the green DI+ line crossed above the red DI minus on the All ADX Dashboard at 1.1023.
The ADX with DeMarker indicator simultaneously displayed a green arrow.
A long trade was entered at 1.1024 with a stop loss at 1.1018.
Price moved quickly upward to 1.1038 before a red arrow appeared.
The trade closed with a 14 pip profit, showing how aligning momentum and trend can produce profitable scalps.
Example Case Study 2 (GBPUSD M5 bearish scalp)
On GBPUSD M5, the red DI minus line crossed above the green DI+ at 1.2632, signaling bearish bias.
The ADX with DeMarker indicator displayed a red arrow.
A short position was opened at 1.2630 with a stop loss at 1.2643.
Price dropped to 1.2615 before the CCI indicated a potential reversal.
The trade closed for a 15 pip profit.
Strategy Tips
- Focus on pairs with tight spreads and good liquidity to reduce trading costs on small timeframes.
- Only take trades where the DI cross and arrow signals are both clear to improve accuracy.
- Consider checking the trend on H1 or H4 charts to align scalps with the overall market direction.
- Use smaller lot sizes initially to test the strategy and adjust based on pair volatility.
- Monitor price action around support and resistance levels to improve entries and exits.
- Stay disciplined and avoid chasing trades if signals are not confirmed on M1 or M5 charts.
- Use a simple timer or session filter to trade during periods of high market activity for better results.
- Combine this strategy with basic money management rules to preserve capital during streaks of losses.
- Keep an eye on sudden market spikes that can cause DI lines and arrows to generate false signals.
- Review your trading history weekly to identify the most reliable currency pairs and timeframes for this method.
Download Now
Download the “all-adx-indicator.mq4” Metatrader 4 indicator
FAQ
What does the ADX line show?
The yellow ADX line indicates trend strength. A rising ADX suggests a strong trend, while a falling ADX signals a weakening trend.
How should I handle conflicting signals across timeframes?
Focus on signals that match the dominant trend shown by the ADX line. Wait for alignment before entering trades for higher probability setups.
Can the ADX period be changed?
Yes, the default period is 14, but it can be adjusted in the indicator’s inputs tab to fit your trading strategy.
Summary
The All ADX Dashboard indicator for MT4 provides Forex traders with a clear view of trend strength and DI crossover signals across multiple timeframes.
Green and red crossovers make it easy to spot buy and sell opportunities.
This tool is ideal for monitoring trend alignment without checking multiple charts.
By combining DI cross signals with the ADX strength line, users can identify strong trends, avoid weak signals, and plan entries and exits efficiently.


