
About the Squeeze Break Indicator
The Squeeze Break Indicator for MT4 is a momentum and volatility tool based on the core principles detailed in John Carter’s “Mastering the Trade.”
It operates on the market reality that price action moves in cycles, transitioning from periods of low-volatility compression to high-volatility expansion.
To capture these shifts, the indicator intelligently combines Bollinger Bands and Keltner Channels into a single histogram format.
When the Bollinger Bands contract and move inside the Keltner Channels, it signals a “squeeze,” indicating the market is building pressure for a breakout.
Conversely, when the bands expand beyond the channels, the histogram reflects a surge in volatility.
Free Download
Download the “squeeze-break-indicator.ex4” MT4 indicator
Key Features
- Combines Bollinger Bands and Keltner Channels to identify precise market compression zones.
- Uses a color-coded histogram to differentiate between trending and consolidating market phases.
- Displays green histograms in the positive region to signal active trend volatility.
- Shows red histograms in the negative region to highlight low-volatility squeeze periods.
- Functions as a powerful filter to keep traders out of choppy, sideways price action.
Indicator Chart
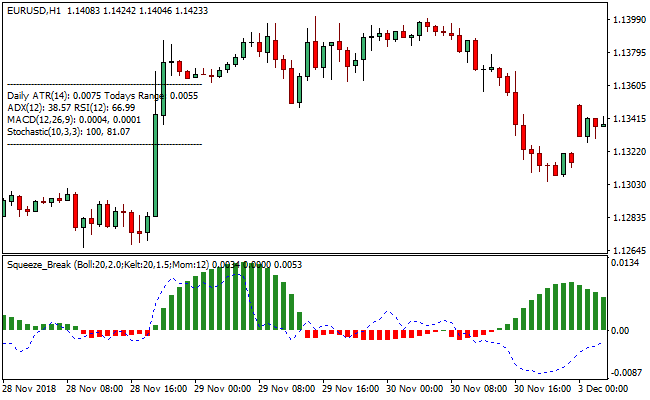
The chart displays the Squeeze Break Indicator providing a clear trade bias through its histogram bars.
Green bars rising above the zero line indicate that the market has broken out of a squeeze and is currently trending with high volatility.
The red bars appearing below the zero line represent the consolidation phase where price is tightly coiled and preparing for the next significant move.
Guide to Trade with Squeeze Break Indicator
Buy Rules
- Monitor the indicator window for the transition from red to green histogram bars.
- Wait for the Squeeze Break Indicator to print a green histogram in the positive territory.
- Ensure the price action on the main chart is breaking above a recent resistance level.
- Enter the long position as soon as the first green bar is confirmed on a candle close.
Sell Rules
- Monitor the indicator window for the transition from green to red histogram bars.
- Wait for the Squeeze Break Indicator to align red histograms in the negative territory.
- Verify that the price is trending downward or breaking below a recent support floor.
- Initiate the short trade once the negative alignment is confirmed by the indicator.
Stop Loss
- Place the stop loss a few pips below the most recent consolidation range for buy entries.
- Position the protective stop above the high of the squeeze period when entering a sell.
- Set the stop loss based on the current Keltner Channel midline for a dynamic exit.
- Adjust the stop to break even once the momentum generates a significant price extension.
Take Profit
- Close all buy orders if the indicator displays a red histogram below the zero signal level.
- Close all sell orders if the indicator puts up a green histogram above the zero center line.
- Consider exiting manually if the histogram bars begin to shorten, signaling a loss of momentum.
Squeeze Break + NeuroTrend Forex Scalping Strategy for MT4
This strategy uses the Squeeze Break MT4 Forex Indicator together with the NeuroTrend MT4 Forex Indicator.
The Squeeze Break indicator helps detect when the market moves from quiet consolidation to a trending phase.
A green histogram indicates that the market is ready for a buy trade, and a red histogram indicates a sell trade.
NeuroTrend provides directional trend confirmation, showing a blue dot for a bullish trend and a red dot for a bearish trend.
Combining these indicators allows traders to scalp in the direction of the emerging trend.
This strategy works well on M5, M15, and H1 charts and is suitable for active scalpers focusing on liquid forex pairs.
Buy Entry Rules
- The Squeeze Break histogram is green, showing that a trend is forming.
- The NeuroTrend indicator shows a blue dot, indicating a bullish trend.
- Price is near a support area or within the middle range of the recent swing.
- Enter a long position at the close of the candle that shows the blue dot.
- Place a stop loss a few pips below the recent swing low or support level.
- Set a take profit target based on the next resistance level or a fixed number of pips, aiming for a risk-reward ratio between 1:1.5 and 1:2.
Sell Entry Rules
- The Squeeze Break histogram is green, showing that a trend is forming.
- The NeuroTrend indicator shows a red dot, indicating a bearish trend.
- Price is near a resistance area or within the upper range of the recent swing.
- Enter a short position at the close of the candle that shows the red dot.
- Place a stop loss a few pips above the recent swing high or resistance level.
- Set a take profit target near the next support level or a fixed number of pips, aiming for a risk-reward ratio between 1:1.5 and 1:2.
Advantages
- Combining trend confirmation and momentum reduces the likelihood of false signals.
- Entry signals are easy to interpret using a histogram and trend dots.
- Works on multiple intraday timeframes, including M5, M15, and H1.
- Stop loss and take profit levels are easy to define based on price action and trend.
- Effective for scalping during active trading sessions with sufficient liquidity.
Drawbacks
- Signals may lag slightly in very fast-moving markets, causing late entries.
- Short-term timeframes like M5 may be affected by spreads and broker execution speed, reducing net profitability.
- Not suitable for illiquid or exotic currency pairs due to high slippage and unreliable signal accuracy.
- Requires constant attention to market conditions; leaving trades unattended may result in losses if trends reverse quickly.
Case Study 1: EURUSD on M15
During the New York session, the Squeeze Break histogram turned green, indicating trend conditions.
NeuroTrend displayed a blue dot confirming a bullish trend.
Price was near 1.0920, close to a short-term support.
A long trade was entered at 1.0921 with a stop loss at 1.0908 and a take profit at 1.0950.
Price moved upward steadily and reached the target in 25 minutes.
The trade resulted in a gain of approximately 29 pips.
Case Study 2: GBPJPY on M5
During the Asian session, the Squeeze Break histogram turned green, showing an increase in volatility.
NeuroTrend displayed a red dot indicating a bearish trend.
GBPJPY was near 159.35 at a recent resistance.
A short position was entered at 159.34 with a stop loss at 159.50 and a take profit at 159.00.
Price moved downward and reached the take profit within 18 minutes.
The trade resulted in a gain of about 33 pips.
Strategy Tips
- Trade major and high liquidity pairs to reduce spreads and slippage.
- Do not trade when the Squeeze Break histogram is flat or switching frequently, as the market is likely ranging.
- Focus on active sessions such as London and New York because volatility and price movements are higher.
- Use strict position sizing and risk only a small portion of your account per trade.
- Combine entries with nearby support and resistance levels to improve accuracy for entries and exits.
Download Now
Download the “squeeze-break-indicator.ex4” Metatrader 4 indicator
FAQ
What is the “squeeze” phase in the Squeeze Break Indicator?
The squeeze phase occurs when the Bollinger Bands move inside the Keltner Channels, represented by red histograms in the negative region.
This indicates that the market is in a period of exceptionally low volatility.
Is the Squeeze Break Indicator better as a trend filter or an entry tool?
While it functions excellently as an entry tool for momentum breakouts, its greatest benefit is as a trend filter.
By showing you exactly when the market is consolidating, it prevents you from taking trades during low-probability periods.
Can I use the Squeeze Break Indicator for intraday scalping?
Yes, this indicator is highly effective for scalping on M5 and M15 timeframes.
Scalpers look for the first green histogram bar to appear after a long period of red bars, signaling that momentum is returning to the market.
Summary
The Squeeze Break Indicator is an essential tool for any trader looking to master market cycles.
By providing a visual representation of the shift from low to high volatility, it takes the guesswork out of identifying potential breakout setups.
Its reliance on the time-tested combination of Bollinger Bands and Keltner Channels ensures that its signals are rooted in sound mathematical principles.
While it is a robust standalone tool for capturing momentum, its usability increases when paired with a trend-following indicator to confirm the overall market direction.


