
About the TSV Bullish Bearish Signals Indicator
The TSV Bullish Bearish Signals MetaTrader 4 indicator is a momentum and volume-based tool displayed as a colored histogram.
It is designed to help traders identify prevailing market sentiment by visualizing buying and selling pressure.
The indicator appears in a separate window and uses color changes to reflect shifts in market direction.
Blue histogram bars indicate bullish sentiment, showing that buying pressure is dominant.
Red histogram bars reflect bearish sentiment, suggesting that selling pressure is controlling price movement.
This simple color-based approach allows traders to quickly assess whether a market is being accumulated or distributed.
The TSV indicator is similar in concept to on-balance volume, as it measures the flow of money into and out of the market.
Because of this, it is often used as a confirmation tool to validate price action and trend direction rather than as a standalone signal generator.
Free Download
Download the “tsv-bullish-bearish.ex4” MT4 indicator
Key Features
- Histogram-based indicator displayed in a separate window.
- Blue bars represent bullish market pressure.
- Red bars represent bearish market pressure.
- Volume-inspired logic similar to on-balance volume.
- Useful as a trend and entry confirmation filter.
Indicator Chart
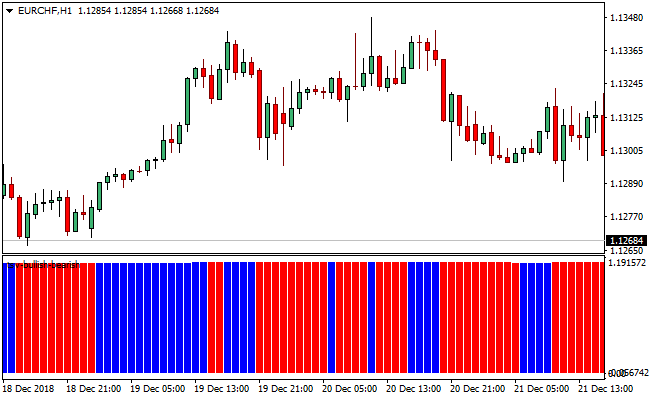
The chart below shows the TSV Bullish Bearish Signals indicator plotted beneath the price chart.
Blue and red histogram bars visually represent shifts in buying and selling pressure.
These changes often align with trend continuation or early reversals.
Guide to Trade with TSV Bullish Bearish Signals Indicator
Buy Rules
- Wait for blue histogram bars to appear in the indicator window.
- Confirm consecutive blue bars are forming.
- Check that price action supports upward movement.
- Enter a buy trade after the blue bar closes.
Sell Rules
- Wait for red histogram bars to appear in the indicator window.
- Confirm consecutive red bars are forming.
- Check that price action supports downward movement.
- Enter a sell trade after the red bar closes.
Stop Loss
- Place the stop beyond the most recent swing high or low.
- Keep the stop outside short-term consolidation ranges.
- Avoid placing stops directly at recent candle extremes.
- Adjust the stop as price continues in the trade direction.
Take Profit
- Target nearby support or resistance zones.
- Hold the position while the histogram color remains unchanged.
- Exit partially if the histogram momentum weakens.
- Close the trade when an opposite color bar appears.
MT4 Day Trading Strategy: TSV Bullish Bearish + LRMA Bollinger Bands
This day trading method combines the TSV Bullish Bearish Signals indicator with the LRMA Bollinger Bands indicator to find clean intraday moves.
The TSV indicator gives clear momentum shifts using blue histogram bars for bullish pressure and red bars for bearish pressure.
The LRMA Bollinger Bands provide the trend direction by rising in upward markets and declining during downtrends.
This combination works well because you trade only in the direction of the main trend.
Momentum confirms the trend before you enter.
Use this strategy on M15, M30, and H1 charts for day trading.
Buy Rules
- Wait for the TSV histogram to turn blue, signaling bullish momentum.
- Confirm that the LRMA Bollinger Bands are rising, indicating an upward trend.
- Ensure the current price is above the midline of the LRMA Bollinger Bands.
- Enter a long position at the close of the candle that meets all conditions.
- Place a stop loss just below the recent swing low or the lower Bollinger Band for protection.
- Set a take profit target at a 1:2 risk-to-reward ratio, or near the opposite Bollinger Band, and consider trailing the stop for extended moves.
Sell Rules
- Wait for the TSV histogram to turn red, signaling bearish momentum.
- Confirm that the LRMA Bollinger Bands are declining, indicating a downward trend.
- Ensure the current price is below the midline of the LRMA Bollinger Bands.
- Enter a short position at the close of the candle that meets all conditions.
- Place a stop loss just above the recent swing high or the upper Bollinger Band for protection.
- Set a take profit target at a 1:2 risk-to-reward ratio, or near the opposite Bollinger Band, and consider trailing the stop to capture extended moves.
Case Study 1: GBPJPY H1
During a London session breakout, GBPJPY printed a clean upward trend.
The TSV histogram turned blue while the LRMA Bollinger Bands started rising.
Price held above the midline for several candles.
A buy entry was taken just after the TSV confirmed momentum.
A stop loss was placed under the last swing.
Price continued upward for over 70 pips before reaching the upper band, hitting the profit target with a smooth momentum buildup.
Case Study 2: AUDCAD M30
AUDCAD began a downward move during the New York session.
The LRMA Bollinger Bands started sloping downward, showing a steady bearish trend.
The TSV histogram turned red for multiple bars.
A sell trade was taken as the price pulled back into the midline.
The market then dropped for around 45 pips before flattening, allowing the trade to close at the planned target.
The combination prevented premature entries and filtered out weaker setups earlier in the session.
Strategy Tips
- Avoid trades when the LRMA Bollinger Bands are flat or moving sideways
- Stronger moves occur after long periods of compression inside the bands
- Check major session openings as they often create trend setups
- Use trailing stops during strong trends to capture extended moves
- Wait for a second histogram bar for extra confirmation in volatile markets
Download
Download the “tsv-bullish-bearish.ex4” Metatrader 4 indicator
FAQ
What type of indicator is the TSV Bullish Bearish Signals?
It is a volume-inspired momentum indicator displayed as a histogram.
It focuses on measuring buying and selling pressure rather than price alone.
Does the TSV indicator work better as a filter?
Yes. Many traders use it to confirm entries generated by price action or trend indicators.
It helps validate whether momentum supports the trade idea.
Can the TSV indicator detect early trend changes?
Color shifts in the histogram can sometimes appear before visible price reversals.
This makes it useful for spotting early changes in market sentiment.
Summary
The TSV Bullish Bearish Signals MT4 indicator offers a simple and effective way to visualize market sentiment.
By translating buying and selling pressure into clear histogram colors, it helps traders stay aligned with dominant momentum.
Its similarity to on-balance volume makes it especially useful as a confirmation tool.
When combined with price action or trend indicators, the TSV indicator can enhance timing and confidence in trade decisions.


