
About the Trend Trigger Factor TTF Indicator
The Trend Trigger Factor, commonly known as the TTF indicator, is a momentum-based tool developed to identify trend direction and strength.
It was introduced by M. H. Pee in the December 2004 issue of Technical Analysis of Stocks and Commodities magazine.
While it was originally used in stock and commodities markets, it has since gained popularity among forex traders.
The TTF indicator shares similarities with the RSI, but it focuses more on trend triggering rather than overbought or oversold conditions.
It plots a single oscillating line that moves around a zero center line and interacts with fixed threshold levels.
These levels help traders distinguish between bullish and bearish phases with greater confidence.
By simplifying trend evaluation into clear numerical zones, the TTF indicator helps traders align with prevailing market sentiment.
It is often used to confirm trend continuation and filter out countertrend signals during volatile conditions.
Free Download
Download the “ttf-indicator.ex4” MT4 indicator
Key Features
- Momentum-based oscillator similar to the RSI.
- Uses fixed levels to define bullish and bearish zones.
- Zero center line for overall market sentiment.
- Effective for trend confirmation and continuation setups.
- Originally designed for stocks, adapted for forex trading.
Indicator Chart
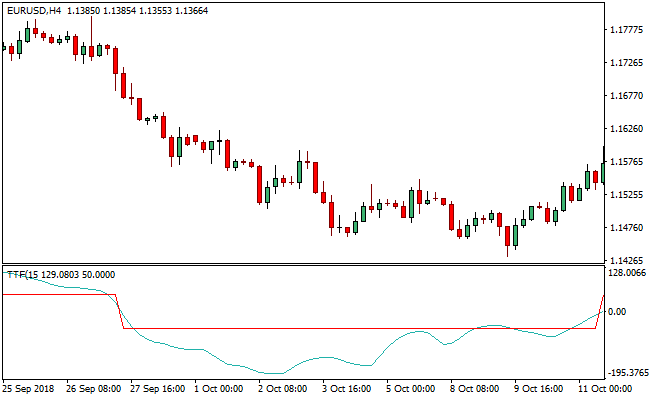
The chart below shows the Trend Trigger Factor TTF indicator displayed in a separate window under the price chart.
The light sea green line oscillates around the zero level and reacts to the +100 and -100 thresholds.
These movements help highlight trend shifts and momentum expansion.
Guide to Trade with Trend Trigger Factor TTF Indicator
Buy Rules
- Wait for the TTF line to break above the -100 level.
- Confirm the indicator remains above the zero center line.
- Check that momentum is expanding upward.
- Enter a buy trade after the breakout is confirmed.
Sell Rules
- Wait for the TTF line to break below the +100 level.
- Confirm the indicator remains below the zero center line.
- Check that downward momentum is increasing.
- Enter a sell trade after the breakout is confirmed.
Stop Loss
- Place the stop near the most recent swing level.
- Keep the stop beyond short-term price reactions.
- Avoid placing stops directly on indicator levels.
- Adjust the stop as momentum continues in your favor.
Take Profit
- Target prior support or resistance zones.
- Hold the trade while the TTF remains on the same side of zero.
- Scale out if momentum starts to slow.
- Exit when the indicator reaches the opposite threshold.
MT4 Day Trading Strategy: Trend Trigger Factor + No-Lag Moving Average
This day trading strategy combines the Trend Trigger Factor (TTF) Indicator and the No-Lag Moving Average (NLMA).
The TTF gives a clear signal when it rises above the 0 level for a buy and falls below 0 for a sell.
The No-Lag MA shows trend direction with its line color: blue for bullish and red for bearish.
Together, they provide a clean day trading approach with strong trend filtering and early signal timing.
This system works well on M15, M30, and H1, making it suitable for intraday traders who want structured and consistent entries.
It is simple to follow: wait for the TTF to cross the 0 level, then confirm with the color of the No-Lag Moving Average.
This reduces noise and helps you stay aligned with genuine trend direction throughout the day.
Buy Entry Rules
- TTF must rise above the 0 level, giving a bullish signal.
- The No-Lag MA line must be blue, showing a bullish trend.
- Enter long after the candle closes with both conditions valid.
- Place stop loss below the No-Lag MA or below the nearest swing low.
- Take profit: 25–40 pips on M15, 40–60 pips on M30, or 60–100 pips on H1.
Sell Entry Rules
- TTF must fall below the 0 level, giving a bearish signal.
- The No-Lag MA line must be red, confirming a bearish trend.
- Enter short after the candle closes with both signals aligned.
- Place stop loss above the No-Lag MA or above the nearest swing high.
- Take profit: 25–40 pips on M15, 40–60 pips on M30, or 60–100 pips on H1.
Advantages
- TTF gives early directional signals when crossing the 0 level.
- No-Lag MA confirms trend direction without much delay.
- Simple rules make it ideal for day traders wanting clean setups.
- Reduces false entries by requiring trend confirmation.
- Works well on major and cross pairs with decent volatility.
Drawbacks
- Signals may come late during strong momentum spikes.
- Ranging market conditions can cause rapid TTF whipsaws.
- No-Lag MA may switch colors during consolidation, causing hesitation.
- Requires patience, as some days offer fewer valid setups.
Case Study 1 – CAD/JPY on M30
During the London morning session, CAD/JPY was in a steady uptrend.
The TTF indicator crossed above the 0 level after several hours of sideways movement.
At the same time, the No-Lag MA showed a clear blue line, confirming bullish direction.
A buy trade was opened on the candle close.
Price moved upward gradually and reached more than 55 pips of profit before the trend began to slow near a resistance zone.
Case Study 2 – EUR/AUD on H1
EUR/AUD formed a clear downward structure near the start of the US session.
The TTF dropped below the 0 level and held there for several candles.
Meanwhile, the No-Lag MA remained fully red, confirming bearish dominance.
A sell position was taken once a clean candle close appeared below the moving average.
The market moved strongly for the next several hours, producing around 90 pips before pausing at support.
Strategy Tips
- If the No-Lag MA is flat, skip the setup even if TTF crosses the 0 level. Flat conditions usually mean low momentum and choppy price action.
- Use session timing to your advantage. London and early New York sessions typically offer the strongest trends for this system.
- When TTF crosses the 0 level with a strong slope and long candle bodies, the move often continues. These conditions can justify a slightly larger take profit.
- Look for a clean market structure: higher highs and higher lows for buys, lower highs and lower lows for sells. This supports the indicator signals and filters out weak moves.
- Reduce position size when trading pairs with higher volatility, like GBP/JPY or EUR/NZD, to avoid oversized drawdowns.
- If the price repeatedly tests the No-Lag MA without breaking it, it often acts as a dynamic support or resistance zone. Use this behavior to refine entries.
- Trail your stop loss only after the price has moved at least halfway to your target. This avoids premature stop-outs during normal retracements.
- Use partial closing for longer intraday moves: take half at your initial target and let the rest follow the trend as long as TTF stays above or below zero.
- When TTF sharply flips back across the 0 line, exit immediately. This often signals the end of the current directional wave.
Download Now
Download the “ttf-indicator.ex4” Metatrader 4 indicator
FAQ
How is the TTF indicator different from RSI?
While both are oscillators, the TTF focuses on trend triggering rather than overbought and oversold conditions.
Its fixed levels are designed to capture sustained directional movement.
What market conditions suit the TTF indicator best?
The TTF performs best in trending markets where momentum is clearly expanding.
In sideways conditions, signals may become less consistent.
Can the TTF indicator be used on lower timeframes?
Yes. It can be applied to any timeframe, but lower timeframes may require additional confirmation due to faster momentum shifts.
Summary
The Trend Trigger Factor TTF MT4 indicator offers a straightforward way to identify bullish and bearish momentum.
Using fixed threshold levels and a zero center line simplifies trend analysis into actionable signals.
Its RSI-style behavior combined with trend-focused logic makes it a useful addition for traders who want clearer confirmation of market direction and momentum strength.


