About the Accumulation Swing Index (ASI) Indicator
The Accumulation Swing Index (ASI) Indicator for MT5, developed by Welles Wilder, is a trend-following tool designed to identify potential turning points in the market.
It helps traders determine when a trend is strengthening or weakening and provides a reliable guide for trade entries and exits.
The ASI plots a dark-orange line in a separate window below the main price chart.
Rising readings indicate bullish momentum, while declining readings suggest bearish momentum.
Crossovers and peaks can signal potential trend reversals.
The indicator offers customizable parameters such as ATR, bars, color, and line style.
These settings allow traders to adjust sensitivity and tailor the indicator to their preferred timeframe and trading strategy.
It is recommended to use the ASI alongside other technical tools, such as support and resistance, moving averages, or oscillators, to confirm trade setups.
Free Download
Key Features
- Measures market momentum and trend strength.
- Identifies potential turning points in trending markets.
- Plots a non-repainting dark-orange line below the main price chart.
- Customizable ATR, bars, color, and style settings.
- Works on all trading instruments offered in MT5.
- Can be combined with other technical tools for precise entries.
Indicator Chart
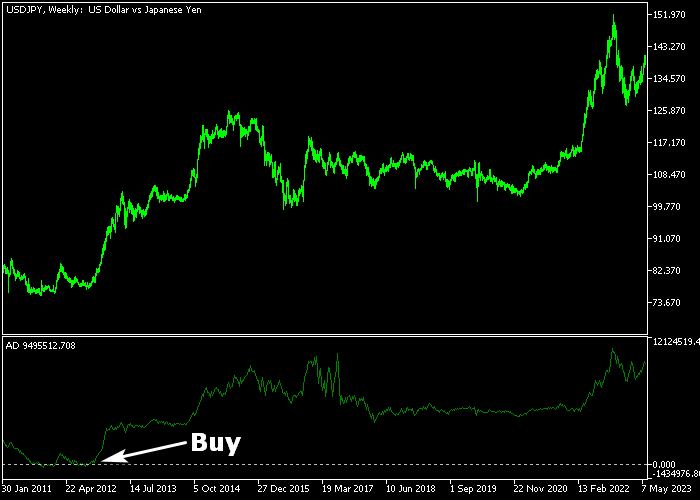
The Accumulation Swing Index appears in a separate window below the price area. The dark-orange line oscillates to reflect current market momentum.
High ASI readings indicate a strong upward trend, while low readings signal a downward trend.
Peaks and troughs help traders anticipate possible trend reversals and time entries effectively.

Guide to Trade with the Accumulation Swing Index Indicator
Buy Rules
- Wait for the ASI line to show rising momentum in an uptrend.
- Confirm the market trend is bullish on a higher timeframe.
- Enter a buy trade when the line begins a sustained upward movement.
- Optionally, wait for a minor pullback to improve the entry price.
Sell Rules
- Wait for the ASI line to show declining momentum in a downtrend.
- Confirm the market trend is bearish on a higher timeframe.
- Enter a sell trade when the line begins a sustained downward movement.
- Optionally, wait for a minor retracement to improve the entry price.
Stop Loss
- For buy trades, place the stop slightly below the most recent support level.
- For sell trades, place the stop slightly above the most recent resistance level.
Take Profit
- Exit buy trades when momentum slows or a bearish reversal signal appears.
- Exit sell trades when momentum slows or a bullish reversal signal appears.
- Partial profit-taking can be applied at intermediate support or resistance levels.
Accumulation Swing Index Forex Strategy for MT5
This strategy combines the Accumulation Swing Index (ASI) Indicator with the MA Candles Indicator to capture both fast scalping moves and longer intraday trends.
It works well on major and cross pairs where momentum and candle patterns are clearer.
The ASI indicator signals momentum: a rising ASI line suggests bullish strength, while a falling line indicates bearish pressure.
The MA Candles indicator confirms trend direction with consecutive colored candles: green candles establish a buy trend, and orange candles signal a sell trend.
Combining these signals allows traders to enter trades with both momentum and trend confirmation.
This strategy is suitable for M1 and M5 charts for scalping, and M15 or M30 charts for day trading.
Buy Entry Rules
- Wait for the ASI line to start rising, indicating bullish momentum.
- Confirm that MA Candles show consecutive green candles, signaling an established buy trend.
- Enter a buy trade at the close of the confirmation candle.
- Place the stop loss below the most recent swing low or below the green candle cluster.
- Take profit between 8 and 25 pips for scalping, or near the next resistance level for day trades.
Sell Entry Rules
- Wait for the ASI line to start falling, indicating bearish momentum.
- Confirm that MA Candles show consecutive orange candles, signaling an established sell trend.
- Enter a sell trade at the close of the confirmation candle.
- Place the stop loss above the most recent swing high or above the orange candle cluster.
- Take profit between 8 and 25 pips for scalping, or near the next support level for day trades.
Case Study 1 Buy Trade (AUDUSD, M5)
During the London session on AUDUSD using the M5 timeframe, the ASI line started rising, signaling bullish momentum.
The MA Candles indicator confirmed an established buy trend with three consecutive green candles.
A buy trade was opened at the close of the confirmation candle. The stop loss was set below the recent swing low.
Price moved up quickly, and the trade was closed when a minor resistance area was reached and the ASI line started flattening.
Case Study 2 Sell Trade (USDCHF, M15)
During the New York session on USDCHF using the M15 timeframe, the ASI line started falling, indicating bearish momentum.
The MA Candles indicator showed four consecutive orange candles, confirming a sell trend.
A sell trade was executed at the candle close. The stop loss was placed above the recent swing high.
Price declined steadily, and the trade was exited when the MA Candles pattern indicator began showing green candles.
Download Now
FAQ
What does a high ASI reading indicate?
A high ASI reading shows that bullish momentum is strong, suggesting the market trend is rising and buyers are in control.
What does a low ASI reading indicate?
A low ASI reading reflects bearish momentum, signaling that sellers dominate and the market is trending downward.
How can I combine ASI with other indicators?
The ASI works well with moving averages, trend lines, and oscillators to confirm trade entries and strengthen trend reversal signals.
Can the ASI be used for short-term trading?
Yes, it can be applied to both intraday and swing trading, but sensitivity adjustments may be needed on lower timeframes for scalping or quick trades.
Summary
The Accumulation Swing Index (ASI) Indicator tracks market momentum and highlights potential trend turning points with a straightforward line visualization.
Rising readings indicate bullish pressure, while falling readings signal bearish momentum.
Its simplicity and adaptability make it a useful tool for traders of all levels.
When combined with other technical analysis tools, the ASI enhances the ability to identify strong trends, capture reversals, and manage trades effectively across different market conditions.


