About the Ehlers Fisher MTF Indicator
The Ehlers Fisher MTF Indicator serves as a precision timing tool for traders who need to know exactly when a price correction has ended and a trend is resuming.
From a practical standpoint, this indicator solves the “vague curve” problem found in RSI or Stochastic oscillators by transforming price cycles into sharp, vertical peaks and troughs.
This makes the transition from a bearish state to a bullish state much more distinct.
When you see the bars flip from red to green across the zero line, it provides a definitive signal that the immediate momentum has shifted, allowing for tighter entries and smaller stop losses.
For the intraday trader, the multi-timeframe capability is the most valuable feature.
You can monitor the momentum of the 1-hour chart while executing trades on the 5-minute chart, ensuring you never “catch a falling knife” against a major trend.
The indicator is particularly effective during high-liquidity sessions where price tends to follow mathematical distributions more closely.
Free Download
Download the “ehlers-fisher-transform-mtf.ex4” MT4 indicator
Key Features
- Oscillates around a neutral zero line to provide objective buy and sell signals.
- Dual-colored bar system with green bars for bullish moves and red bars for bearish moves.
- Multi-timeframe functionality to track momentum across different periods simultaneously.
- Sharp turning points that reduce the ambiguity often found in traditional oscillators.
- Highly effective when used as a timing tool in conjunction with trend-following filters.
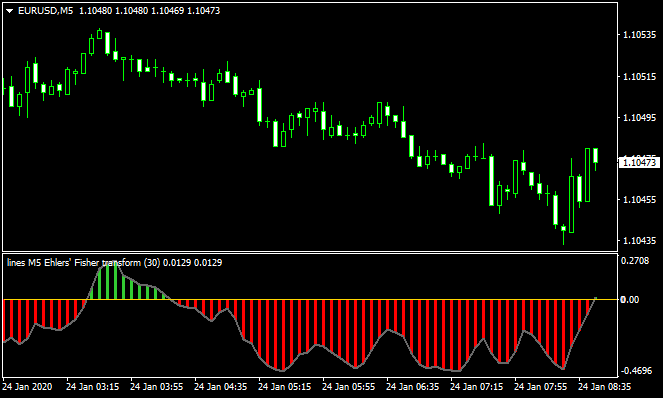
Indicator Chart
The Ehlers Fisher MTF Indicator chart features a dedicated window below the main price area where vertical bars fluctuate.
When the bars cross above the zero level and turn green, the chart indicates a positive short-term trend shift.
When the bars drop below the zero level and turn red, it signals a negative short-term trend shift.

Guide to Trade with Ehlers Fisher MTF Indicator
Buy Rules
- First, identify a bullish long-term trend using a 200-period Simple Moving Average.
- Wait for the Ehlers Fisher MTF Indicator to cross above the zero line from below.
- Confirm that the indicator bars have turned green on the current timeframe.
- Open a buy position at the close of the candle where the green bar is established.
Sell Rules
- Confirm a bearish long-term trend by ensuring price is below a 200-period SMA.
- Monitor the indicator for a cross below the zero line from an upper position.
- Ensure the Ehlers Fisher MTF Indicator bars have switched to a solid red color.
- Initiate a sell trade once the candle closes and the red signal is confirmed.
Stop Loss
- For buy entries, place your stop loss below the most recent support or swing low.
- For sell entries, position your stop loss above the nearest resistance or swing high.
- Consider moving the stop loss to break even once price moves significantly in your favor.
Take Profit
- Exit the trade when the bars of the Ehlers Fisher MTF Indicator change color.
- Alternatively, set a profit target at a pre-defined risk-to-reward ratio of 1:2.
- You may also take profit at major technical levels like daily pivots or previous day highs.
Ehlers Fisher MTF Indicator + Trend Logic MT4 Day Trading Strategy
This MT4 day trading strategy combines the Ehlers Fisher MTF indicator with the Trend Logic indicator.
Ehlers Fisher MTF shows a histogram: green bars signal bullish momentum, red bars signal bearish momentum.
Trend Logic uses a colored line: a green line indicates a bullish trend, while a red line suggests a bearish trend.
By combining these two, you can trade with the trend while also capturing strong intraday momentum.
This strategy is ideal for M15 and H1 charts, and for traders who want structured entries and exits during active trading sessions like London and New York.
Buy Entry Rules
- Wait for the Ehlers Fisher MTF histogram to turn green, indicating bullish momentum.
- Confirm that the Trend Logic line is green, signaling a bullish trend.
- Enter a long position at the close of the confirming candle.
- Place a stop loss a few pips below the recent swing low or structure level.
- Set take profit to target a 1.5:1 or 2:1 reward-to-risk ratio, or use nearby resistance levels for exit.
Sell Entry Rules
- Wait for the Ehlers Fisher MTF histogram to turn red, indicating bearish momentum.
- Confirm that the Trend Logic line is red, signaling a bearish trend.
- Enter a short position at the close of the confirming candle.
- Place a stop loss a few pips above the recent swing high or structure level.
- Set take profit to target a 1.5:1 or 2:1 reward-to-risk ratio, or use nearby support levels for exit.
Advantages
- The combination of momentum (Fisher) and trend (Trend Logic) delivers more reliable entries.
- Clear visual confirmation with a histogram and a line makes decision‑making easier.
- Scalable across different timeframes: works on M15 and H1.
- Helps filter out low‑momentum noise by requiring both indicators to align.
- Flexible take profit options using fixed risk ratio or structure levels.
Drawbacks
- In choppy markets, the histogram may flip frequently, producing false signals.
- Stop losses may be relatively wide, especially on H1, which can reduce net profitability.
- Trend Logic may lag in very fast, sharp reversals.
- Requires discipline to wait for both indicators to confirm before entering.
- Less effective during very low volatility or when markets are flat.
Example Case Study 1
On EURUSD H1 during the London‑New York overlap, the Ehlers Fisher MTF histogram turned green, showing increasing bullish momentum.
At the same time, the Trend Logic line was clearly green, confirming a strong uptrend.
A buy trade was opened at 1.1085 when the hourly candle closed, with a stop loss placed at 1.1065, just below the recent swing low (20 pips risk).
Price continued to rise steadily. Over the next three hours, EURUSD moved about 40 pips upward to 1.1125, hitting a 2:1 take profit target.
The Fisher histogram remained green, and the Trend Logic line stayed green, reinforcing that the trend and momentum were aligned.
Example Case Study 2
On AUDUSD M15 during the New York session, the Fisher histogram flipped red after a pullback, indicating bearish momentum.
The Trend Logic line had turned red earlier, signaling a broader downtrend.
A short position was taken at 0.6742 when the 15‑minute candle closed, with a stop loss placed at 0.6760 (18 pips), just above a recent swing high.
The pair dropped quickly, with momentum favoring the short trade.
Within about an hour, AUDUSD slid to 0.6708, yielding 34 pips and meeting a 1.8:1 reward-to-risk target.
The Fisher histogram stayed red, and the Trend Logic line remained red, confirming the strong downward movement.
Strategy Tips
- Trade during high‑liquidity sessions like London or New York for the best momentum.
- Use higher timeframes (H1) for trend identification and lower timeframes (M15) for entry timing.
- Consider partially closing your position when the price hits a major structure level to lock in profits.
- Use a trailing stop once the trade moves in your favor and the Fisher histogram continues to support your direction.
- Backtest the strategy on different currency pairs such as EURUSD, AUDUSD, GBPJPY, or USDCAD to find where it performs best.
Download Now
Download the “ehlers-fisher-transform-mtf.ex4” Metatrader 4 indicator
FAQ
How do I use the multi-timeframe feature of this indicator?
The multi-timeframe setting allows you to display the Ehlers Fisher MTF Indicator bars from a higher period, such as the H4, directly on your M15 chart.
This helps you ensure that your short-term scalp or day trade is moving in the same direction as the larger market trend.
Why is a moving average recommended with this indicator?
The Ehlers Fisher MTF Indicator is very sensitive to short-term price changes.
Using a 100 or 200-period moving average acts as a filter to ensure you are only taking signals that align with the long-term trend, which significantly increases your overall win rate.
Can I adjust the sensitivity of the Fisher bars?
Yes, you can modify the period settings in the indicator inputs.
A shorter period will make the indicator more responsive to every small price move, while a longer period will smooth out the bars and provide more stable trend signals.
Summary
The Ehlers Fisher MTF Indicator is a sophisticated tool for traders who want to master short-term momentum within a trend-following framework.
Its unique mathematical base allows for faster signal generation without the excessive noise typical of other oscillators.
The main benefit is the clarity it brings to identifying the exact moment price begins to move in your desired direction.
To achieve the most consistent results, always use it in combination with a long-term trend filter and proper risk management.


