
About the Wilder’s DMI indicator
The Wilder’s DMI indicator for MT5 is a sophisticated technical tool that evaluates the intensity and direction of price trends.
The system consists of the Positive Directional Indicator (+DI) and the Negative Directional Indicator (-DI), which work together to signal shifts in trend dominance.
When these lines interact, they reveal high-probability entry points where one force is overcoming the other.
Additionally, the integrated DMI line measures the overall strength of the trend regardless of direction.
This combination helps you stay focused on the most powerful market moves while avoiding the low-probability trades typically found in weak or directionless price action.
Free Download
wildersdmi.mq5 Indicator (MT5)
Key Features
- The indicator tracks the strength of bullish and bearish movements via the +DI and -DI lines.
- The main DMI line quantifies the intensity of the trend to help identify strong momentum phases.
- Crossover signals between the directional lines provide objective entry and exit triggers.
- Customizable parameters for DMI, ADX, and ADXR allow for tailored sensitivity and smoothing.
- It works as a comprehensive trend-following system across all currency pairs and timeframes.
- Color-coded lines offer an immediate perspective on the prevailing market sentiment.
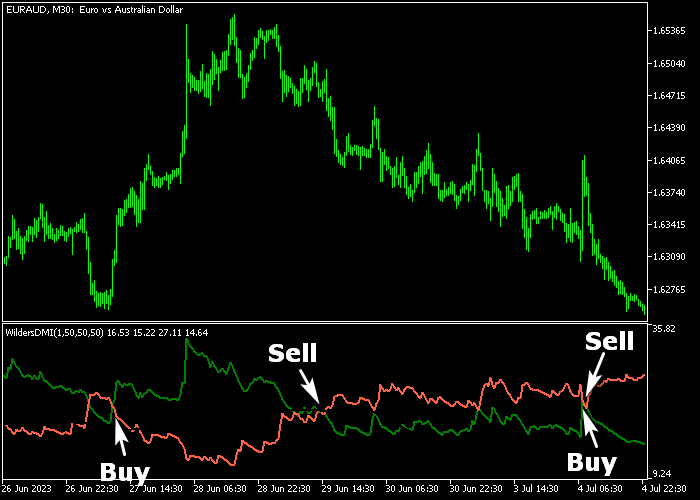
Indicator Chart
The chart shows the Wilder’s DMI indicator displayed in a sub-window with green, tomato, and main trend lines.
You can see how the crossovers between the +DI and -DI lines precede major price runs on the main chart.
The height of the DMI line further confirms if the trend has enough strength to be traded successfully.
Guide to Trade with Wilder’s DMI indicator
Buy Rules
- Enter a buy transaction when the green +DI line crosses above the tomato -DI line from below.
- Confirm that the crossover is supported by an upward slope in the main DMI strength line.
- Execute the buy market order once the directional crossover is clearly established on a closed candle.
- Maintain the long position while the green +DI line remains positioned above the tomato -DI line.
Sell Rules
- Initiate a sell transaction when the green +DI line crosses below the tomato -DI line from above.
- Ensure the market is exhibiting bearish momentum as the tomato -DI line rises above the green line.
- Open a sell market order as soon as the downward crossover is confirmed in the indicator window.
- Keep the short trade active for as long as the bearish -DI line dominates the bullish +DI line.
Stop Loss
- Place a protective stop loss order slightly below the most recent swing low for all buy entries.
- Set a defensive stop loss above the most recent swing high for any sell market positions.
- The crossover point of the DI lines can also serve as a logical reference for stop placement.
- Adjust the stop to break-even once the trend strength increases and price moves in your favor.
Take Profit
- Exit and reverse the current buy trade when a new bearish crossover signal is confirmed on the chart.
- Close a sell position immediately when the green +DI line crosses back above the tomato -DI line.
- Manual exits are recommended if the main DMI line begins to drop, signaling a loss of trend strength.
Wilders DMI Indicator Day Trading MT5 Strategy
This day trading strategy combines directional strength with trend confirmation using the Wilders DMI Indicator and the TrendLord Indicator.
It focuses on capturing intraday trend moves after momentum clearly shifts from buyers to sellers or vice versa.
The Wilders DMI identifies who is in control of the market.
When the green +DI line crosses above the tomato -DI line, buyers take control. When it crosses below, sellers dominate.
These crossovers are widely used as trade signals because they reflect shifts in directional momentum.
The TrendLord Indicator confirms the trend direction using a histogram.
A green histogram signals a buy trend, while a red histogram signals a sell trend.
By combining both, you only trade when momentum and trend direction align, which helps avoid false signals during choppy conditions.
This strategy works best on M15 and M30 timeframes.
Buy Entry Rules
- Wait for the green +DI line to cross above the tomato -DI line from below.
- Confirm that the TrendLord histogram is green.
- Enter a buy trade at the close of the crossover candle.
- Place the stop loss below the recent swing low.
- Close the trade when the +DI line crosses back below the -DI line or when the histogram turns red.
- You can also use a fixed 1:2 risk-to-reward target.
Sell Entry Rules
- Wait for the green +DI line to cross below the tomato -DI line from above.
- Confirm that the TrendLord histogram is red.
- Enter a sell trade at the close of the crossover candle.
- Place the stop loss above the recent swing high.
- Close the trade when the +DI line crosses back above the -DI line or when the histogram turns green.
- Alternatively, use a fixed risk-to-reward ratio such as 1:2.
Case Study 1: EURGBP M15 Buy Setup
On EURGBP M15 during the London session, the green +DI line crossed above the tomato -DI line, signaling a shift in bullish momentum.
At the same time, the TrendLord histogram turned green, confirming the uptrend.
A buy trade was entered at the close of the crossover candle.
The stop loss was placed below the recent swing low.
Price began to move upward steadily as buyers took control.
The trade was closed when the +DI line crossed back below the -DI line and the histogram turned red, following the exact exit conditions defined in the strategy.
Case Study 2: USDCHF M30 Sell Setup
On USDCHF M30 during the New York session, the green +DI line crossed below the tomato -DI line, indicating growing bearish pressure.
The TrendLord histogram was red, confirming the downtrend.
A sell trade was entered at the close of the signal candle. The stop loss was placed above the recent swing high.
Price moved downward as selling momentum increased.
The position was closed for 37 pips profit when the +DI line crossed back above the -DI line and the histogram turned green, matching the defined exit rules and securing the intraday move.
Download Now
wildersdmi.mq5 Indicator (MT5)
FAQ
What is the difference between the +DI and -DI lines?
The +DI line measures the strength of upward price movement, while the -DI line measures the strength of downward price movement.
Their relationship tells you which group, buyers or sellers, is currently in control of the market direction.
How does the DMI period setting affect the signals?
A shorter period makes the indicator more sensitive to recent price changes, leading to faster signals but more potential noise.
A longer period smooths out the data, providing more stable trend signals for long-term trading strategies.
Can I use the ADX period setting with this indicator?
Yes, the ADX period within the settings helps filter the trend strength.
Higher ADX values indicate a very strong trend, which can be used to confirm that a DMI crossover is likely to result in a significant price move.
Summary
The Wilder’s DMI indicator for Metatrader 5 is a popular trend analysis tool offering reliable signals for buying and selling pairs in the Forex market.
It provides a mathematically sound framework for determining both trend direction and trend intensity.
By utilizing the directional crossovers, traders can join emerging trends with high precision.
Overall, it is a robust and time-tested tool that helps traders maintain a disciplined approach to momentum trading.


