About the Daily Price Action Forex Indicator
The Daily Price Action Indicator for MT5 highlights the start of the trading day and continuously updates the day’s high and low levels directly on the price chart.
It provides clear visual cues to help traders understand intraday price action and plan entries and exits.
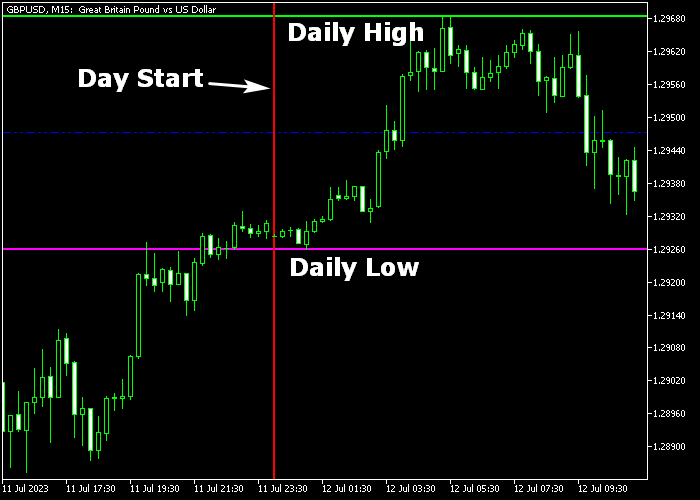
The start of the day is marked with a red vertical line, while the high and low prices are displayed as horizontal lines in green and magenta, respectively.
The indicator updates these levels in real-time as the trading day progresses.
To enhance trend confirmation, the Daily Price Action indicator can be combined with the No-Lag MACD indicator.
This combination helps identify whether the market bias aligns with daily highs and lows, improving entry accuracy.
Free Download
Key Features
- Marks the start of the day with a vertical line.
- Displays real-time daily high and low levels.
- The green line indicates the day high; the magenta line indicates the day low.
- Integrates easily with the MACD indicator for trend confirmation.
- Customizable line colors and styles for all levels.
- Real-time updates throughout the trading session.
Indicator Chart
The Daily Price Action Forex Indicator plots directly in the main price window, showing the red vertical line for the day start and horizontal lines for the daily high and low.
Traders can use these levels to identify support and resistance for intraday trades.
By combining the indicator with MACD, bullish and bearish momentum can be confirmed before taking positions.

Guide to Trade with the Daily Price Action Indicator
Buy Rules
- Wait for price to approach the daily low (magenta line) and show bullish rejection.
- Confirm bullish momentum with MACD trending upward, above 0.
- Enter a buy trade after the candle closes above the low level.
- Align the trade with short-term bullish market bias for intraday setups.
Sell Rules
- Wait for price to approach the daily high (green line) and show bearish rejection.
- Confirm bearish momentum with MACD trending downward, below 0.
- Enter a sell trade after the candle closes below the high level.
- Align the trade with short-term bearish market bias for intraday setups.
Stop Loss
- Place a stop loss just beyond the recent swing high for sell trades.
- Place a stop loss just beyond the recent swing low for buy trades.
- Position stops outside minor intraday volatility to avoid early exits.
Take Profit
- Exit buy trades near the daily high or at a preferred fixed pip target.
- Exit sell trades near the daily low or at a preferred fixed pip target.
- Alternatively, use a dynamic exit strategy based on MACD trend changes.
Daily Price Action Indicator Strategy for MT5
This strategy focuses on capturing reversals at key daily levels using a combination of price action and trend confirmation.
It uses the Daily Price Action Forex Indicator for MT5 to identify important daily highs and lows, while the Two MA Square Bars Indicator MT5 confirms trend direction through colored square signals.
The concept is simple. Price often reacts strongly at daily high and low levels.
When rejection forms at these zones, it creates high probability reversal setups.
The square bar indicator then confirms whether momentum is shifting in the new direction.
This approach works well on M15 and H1 timeframes.
Major currency pairs tend to respond well due to their steady intraday movement.
Buy Entry Rules
- Wait for the candle to approach the daily low marked by the magenta line using the Daily Price Action Forex Indicator.
- Look for clear bullish rejection at this level such as long lower wicks or strong bullish candles.
- Confirm trend shift when the Two MA Square Bars Indicator prints the first two blue squares.
- Enter a buy trade at the opening of the next candle after confirmation.
- Set a stop loss slightly below the daily low or the recent swing low.
- Take profit at the daily high level or when red squares begin to appear.
Sell Entry Rules
- Wait for the candle to approach the daily high marked by the green line using the Daily Price Action Forex Indicator.
- Look for clear bearish rejection at this level such as long upper wicks or strong bearish candles.
- Confirm trend shift when the Two MA Square Bars Indicator prints the first two red squares.
- Enter a sell trade at the opening of the next candle after confirmation.
- Place stop loss slightly above the daily high or the recent swing high.
- Take profit at the daily low level or when blue squares begin to appear.
Case Study 1
On EURUSD M15, price moved down toward the daily low marked by the magenta line.
As price reached this level, it formed a strong bullish rejection with long lower wicks, showing that sellers were losing control.
Shortly after, the Two MA Square Bars Indicator printed two consecutive blue squares, confirming a shift toward bullish momentum.
A buy trade was entered at the next candle open. Stop loss was placed just below the daily low.
Price moved upward steadily throughout the session and approached the daily high.
The trade was closed in profit as price reached this level, capturing a clean reversal move from support to resistance.
Case Study 2
On GBPUSD H1, the currency pair rallied toward the daily high marked by the green line.
At this level, bearish rejection formed with clear upper wicks, signaling potential exhaustion of the uptrend.
The Two MA Square Bars Indicator then printed two consecutive red squares, confirming a bearish trend shift.
A sell trade was opened at the next candle. Stop loss was placed just above the daily high.
Price reversed and moved downward with consistent momentum.
The trade was closed near the daily low, delivering a strong reversal move aligned with both price action and trend confirmation.
Download Now
FAQ
Can this indicator be used on any timeframe?
Yes. It works on all MT5 timeframes, though higher timeframes provide more reliable intraday support and resistance levels.
Does it update the daily high and low levels automatically?
Yes. The indicator continuously updates the high and low throughout the trading day.
Can I combine it with other indicators?
Yes. Combining with MACD is recommended to confirm bullish or bearish momentum before entering trades.
Are the line colors customizable?
Yes. You can modify daily high, daily low, day start colors, and line styles according to your preferences.
Summary
The Daily Price Action Indicator provides real-time visibility of daily open, high, and low levels directly on the chart.
By combining it with the MACD indicator, traders can confirm trend direction and optimize intraday entries.
This tool is ideal for intraday traders seeking structured support and resistance levels and actionable trade signals throughout the trading session.


