About the Strength Index Signal v1.0 Indicator
The Strength Index Signal V1.0 indicator for MT5 measures market momentum to help traders identify strong trends and potential reversals.
It calculates the relative strength of price movements, providing signals when buying or selling pressure dominates.
The indicator is ideal for spotting blue and red arrow based entry points in trending markets and can be used on multiple timeframes.
Traders can rely on it to confirm other technical analysis tools, improving confidence in trade decisions and timing.
Free Download
Strength Index Signal v1.0.mq5 Indicator (MT5)
Key Features
- Displays momentum-based buy and sell signals on the chart.
- Tracks overbought and oversold market conditions with accuracy.
- Supports multiple timeframes for flexible trading strategies.
- Alerts traders to potential trend reversals early.
- Easy to interpret signals suitable for beginners and experienced traders.
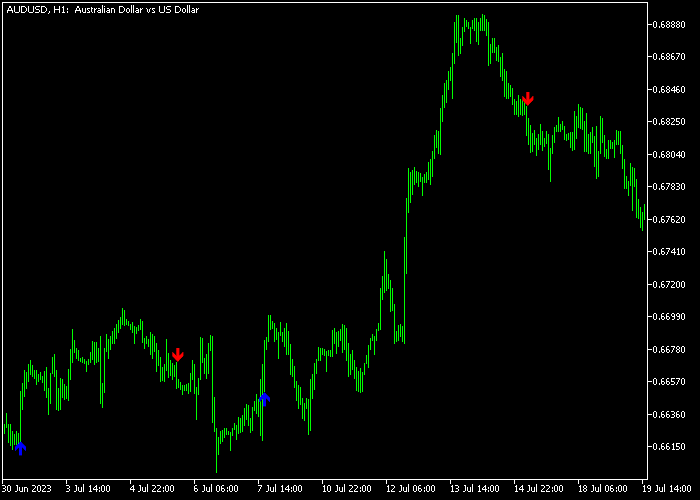
Indicator Chart
The Strength Index Signal V1.0 indicator appears beneath the main price area.
It shows momentum trends with arrows indicating buy and sell signals.
The chart highlights where buying pressure is increasing or selling pressure is taking over, helping traders time entries and exits effectively.

Guide to Trade with Strength Index Signal V1.0
Buy Rules
- Wait for the indicator to show a blue bullish arrow beneath the price.
- Enter a buy trade when the previous candle closes above the signal point.
- Avoid trades against a strong downtrend or near major resistance levels.
Sell Rules
- Wait for the indicator to display a red bearish arrow above the price.
- Open a sell trade after the prior candle closes below the signal point.
- Steer clear of trades against a strong uptrend or near major support zones.
Stop Loss
- Place a stop loss just below the recent swing low for buys.
- Place a stop loss just above the recent swing high for sells.
- Consider ATR-based stops for a dynamic risk approach.
Take Profit
- Close buy trades when the indicator signals a shift or a bearish arrow appears.
- Close sell trades when a bullish arrow or reversal signal appears.
- Alternatively, target strong support or resistance levels for exits.
Strength Index Signal v1.0 Indicator & Pivot Trading Session MT5 Day Strategy
This day trading strategy blends the Strength Index Signal V1.0 Indicator for MT5 with the Pivot Trading Session Indicator for MT5.
The Strength Index Signal gives clear buy and sell arrows with blue arrows for bullish signals and red arrows for bearish signals.
The Pivot Trading Session indicator uses pivot levels to define overall bias.
When price trades above the pivot level, it shows bullish conditions, and price below the pivot level indicates bearish conditions.
This method narrows entries to signals that align with price position relative to pivots.
That means you only trade with the dominant bias and use signal arrows for timing.
It works well on M15 and H1 charts during key trading sessions like London and New York.
Because the strategy uses pivot context and signal confirmation, it helps you avoid countertrend spikes and focus on structured day moves.
Buy Entry Rules
- Confirm price is above the pivot level shown by the Pivot Trading Session indicator, indicating bullish bias.
- Wait for a blue arrow from the Strength Index Signal indicator on M15 or H1.
- Enter a buy trade at the close of the candle with the confirming blue arrow.
- Place the stop loss below the nearest pivot support level or recent swing low.
- Take profit at the next resistance pivot or target a defined 20 to 40 pips, depending on pair volatility.
Sell Entry Rules
- Confirm price is below the pivot level from the Pivot Trading Session indicator, indicating bearish bias.
- Wait for a red arrow from the Strength Index Signal indicator on M15 or H1.
- Enter a sell trade at the closing price of the red signal candle.
- Place the stop loss above the nearest pivot resistance level or recent swing high.
- Take profit at the next pivot support or target 20 to 40 pips, depending on conditions.
London Session Case Study
On the AUD/USD pair during the London open, the candle remained above the pivot level as European market activity began.
The Pivot Trading Session indicator showed price hugging above the pivot with upward bias.
After a pullback, the Strength Index Signal indicator produced a blue arrow on the M15 chart, aligning with bullish sentiment.
A buy trade was entered at the close of the blue arrow candle.
Price moved steadily higher, capturing 25 pips before hitting the next pivot resistance.
The trade was closed at the pivot resistance, locking in profit and respecting the structured pivot zones.
New York Session Case Study
Later in the New York session on the USD/CAD pair, the candle fell below the pivot level, indicating bearish bias.
The Pivot Trading Session indicator showed multiple rejections at pivot resistance.
As the U.S. session gained speed, the Strength Index Signal indicator gave a red arrow on the H1 timeframe.
A sell trade was entered at the close of the H1 red arrow candle. Price declined with clear bearish momentum.
The trade was exited when price approached the next pivot support zone, resulting in a 34 pip profit.
Download Now
Strength Index Signal v1.0.mq5 Indicator (MT5)
FAQ
Can the Strength Index Signal V1.0 be used on any timeframe?
Yes, it works on all timeframes. Shorter periods suit scalping, while longer periods fit swing trading.
How do I reduce false signals?
Combine the indicator with trend confirmation tools like moving averages or volume indicators to filter weaker signals.
Does the indicator provide alerts?
Yes, it can notify traders when buy or sell signals appear, helping to act quickly without constant monitoring.
Is it suitable for all currency pairs?
The indicator works best on major and minor forex pairs with sufficient liquidity. Exotic pairs may produce less reliable signals.
Summary
The Strength Index Signal V1.0 indicator helps traders identify momentum shifts and trend strength efficiently.
Its signals improve entry timing and confidence in trading decisions.
Combining it with other tools or support/resistance analysis can enhance accuracy.
The indicator is user-friendly and adaptable for both beginners and advanced traders, making it a valuable addition to any trading strategy.


