About the Value Chart Oscillator
The Value Chart Oscillator for MT5 is a technical tool designed to reveal overbought and oversold conditions in Forex markets.
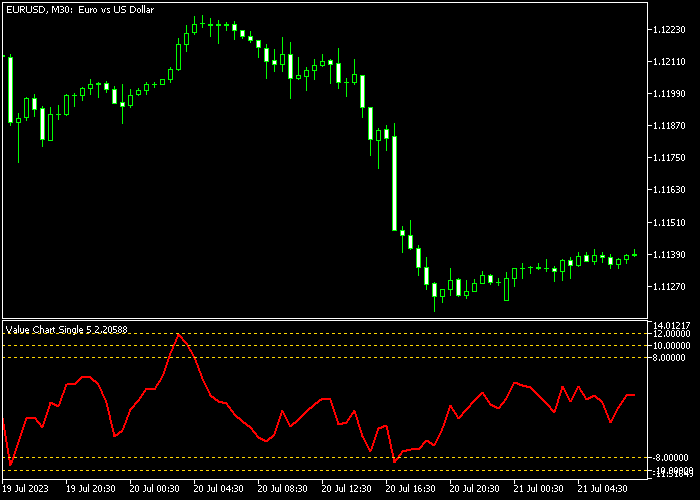
It plots a single red-colored line in a separate chart window, oscillating between 15 and -15 levels.
Traders use these signals to anticipate potential reversals or trend continuations.
A reading above 8 signals an overbought market, while a reading below -8 signals an oversold market.
This indicator allows customization of the period and line color, letting you adapt it to your preferred trading style.
It works across all currency pairs supported on MT5 and is suitable for scalpers, day traders, and swing traders.
Free Download
value_charts_single_jj.mq5 Indicator (MT5)
Key Features
- Identifies overbought and oversold market conditions.
- Plots a red-colored oscillator line in a separate chart window.
- Oscillates between fixed levels for a clear signal reference.
- Customizable indicator period for tailored sensitivity.
- Customizable line color for visual preference.
Indicator Chart
The Value Chart Oscillator is displayed in a separate window beneath the price chart.
It highlights overbought and oversold levels, helping traders anticipate potential market reversals and trend shifts.
The oscillator line clearly shows when price extremes are reached.

Guide to Trade with Value Chart Oscillator
Buy Rules
- Confirm the overall market trend is upward.
- Enter a buy trade when the oscillator crosses back above -8 from below.
- Wait for the oscillator to stabilize above the oversold level before confirming the trade.
Sell Rules
- Confirm the overall market trend is downward.
- Enter a sell trade when the oscillator crosses back below 8 from above.
- Wait for the oscillator to stabilize below the overbought level before confirming the trade.
Stop Loss
- For buy trades, set a protective stop 2–3 pips below the most recent swing low.
- For sell trades, place a protective stop 2–3 pips above the most recent swing high.
- Adjust stops slightly wider in volatile markets to avoid being stopped out prematurely.
Take Profits
- Close buy trades when the oscillator approaches the overbought level around 8.
- Close sell trades when the oscillator approaches the oversold level around -8.
- Alternatively, use a fixed pip target that aligns with your preferred risk-to-reward ratio.
Value Chart Oscillator + Super Trend Hull Day Trading Strategy MT5
This day trading strategy combines the Value Chart Oscillator indicator for MT5 with the Super Trend Hull Forex indicator for MT5.
It focuses on capturing short-term continuation of trends after temporary overbought or oversold conditions.
The strategy works by aligning oscillator momentum reversals with the overall trend direction.
The Value Chart Oscillator identifies extreme price levels and signals when price returns back into a tradable zone.
The Super Trend Hull confirms the dominant direction using a smooth and responsive trend line.
It avoids trading against the trend and instead targets pullbacks that rejoin strong directional moves.
Buy Entry Rules
- Wait for the Super Trend Hull line to turn green and stay below the price, confirming a bullish trend.
- Wait for the Value Chart Oscillator to drop below -8 and then cross back above -8.
- Enter a buy trade at the close of the confirmation candle.
- Place the stop loss below the most recent swing low or below the Super Trend Hull line.
- Take profit when the oscillator approaches the upper extreme zone or when the Super Trend Hull changes color.
Sell Entry Rules
- Wait for the Super Trend Hull line to turn violet and stay above the price, confirming a bearish trend.
- Wait for the Value Chart Oscillator to rise above 8 and then cross back below 8.
- Enter a sell trade at the close of the confirmation candle.
- Place the stop loss above the most recent swing high or above the Super Trend Hull line.
- Take profit when the oscillator approaches the lower extreme zone or when the Super Trend Hull changes color.
Case Study 1: EUR/USD M15 Buy Trade
On the EUR/USD M15 timeframe, the Super Trend Hull line turned green and moved below the price, indicating a bullish trend.
The Value Chart Oscillator dropped below -8, showing an oversold pullback within the uptrend.
The oscillator then crossed back above -8, confirming a momentum shift.
A buy trade was opened at candle close with the stop loss placed below the recent swing low.
Price resumed its upward movement and followed the trend direction.
The trade was closed near the next intraday resistance, securing a target of 31 pips as momentum slowed.
Case Study 2: GBP/USD M30 Sell Trade
On the GBP/USD M30 timeframe, the Super Trend Hull line turned violet and stayed above price, confirming a bearish trend.
Price made a temporary upward pullback, pushing the Value Chart Oscillator above 8.
The oscillator then crossed back below 8, signaling a return to bearish momentum.
A sell trade was executed at candle close, with the stop loss placed above the recent swing high.
Price continued downward in line with the trend.
The short trade was closed near a support level as momentum weakened, delivering a profit of 44 pips.
Download Now
value_charts_single_jj.mq5 Indicator (MT5)
FAQ
Can I use the Value Chart Oscillator on any timeframe?
Yes. This indicator works across all MT5 timeframes, but shorter timeframes provide more frequent signals, while longer timeframes reduce noise.
Can I adjust the sensitivity of the oscillator?
Yes. You can change the indicator period to make it more or less sensitive to price movements.
Should I combine it with other indicators?
For best results, combine with trend confirmation tools like the Hull moving average to align trades with the overall market direction.
Summary
The Value Chart Oscillator is a reliable tool for spotting overbought and oversold market conditions.
It is simple, visual, and effective for both scalpers and swing traders.
Customizable settings allow you to adjust sensitivity and visual style.
Using this oscillator in combination with trend analysis can improve trade timing, enhance entry points, and help manage risk efficiently.
Demo testing is recommended to fully understand its behavior before live trading.


