About the BB Analyzer V2 Forex Indicator
The BB Analyzer V2 Forex Indicator for Metatrader 4 is an advanced Bollinger Bands based tool that converts raw price movement into visually intuitive trading zones.
Instead of relying on traditional line-based bands alone, this indicator highlights price behavior using colored areas that reflect changing market conditions.
Green and red zones appear directly on the main chart and are designed to signal potential trend reversals or exhaustion points.
These zones help traders spot opportunities earlier, especially during periods when volatility begins to expand or contract.
The indicator reacts smoothly to price movement, making it useful for both conservative and more active trading styles.
BB Analyzer V2 can be used as a standalone indicator or combined with other technical tools such as momentum oscillators or support and resistance analysis.
Free Download
Download the “bb-analyzer-v2-indicator.ex4” MT4 indicator
Key Features
- Bollinger Bands based trading logic.
- Colored buy and sell zones on the main chart.
- Helps identify potential trend reversals.
- Supports both trade entry and exit decisions.
- Works across all currency pairs and timeframes.
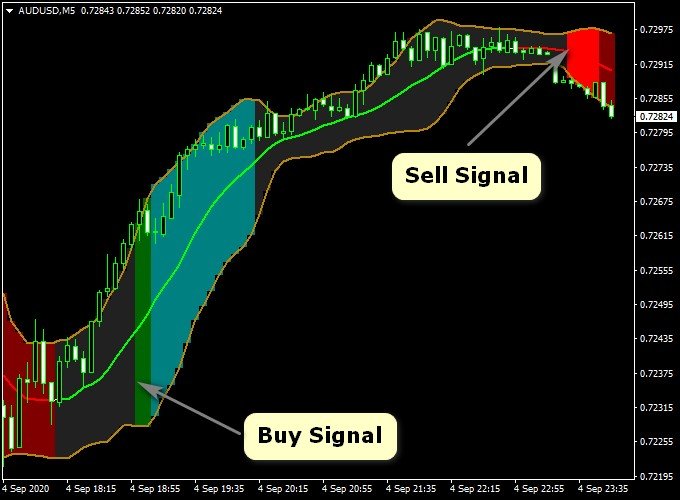
Indicator Chart
The BB Analyzer V2 Forex Indicator is displayed on the main trading chart as Bollinger Bands with colored green and red areas.
Green areas suggest potential bullish reversal zones, while red areas highlight bearish conditions, allowing traders to assess trend direction and timing directly from price action.

Guide to Trade with BB Analyzer V2 Forex Indicator
Buy
- Wait for the green BB Analyzer zone to appear on the chart.
- Confirm that price is reacting near the lower Bollinger Band.
- Open a buy trade after the signal candle closes.
Sell
- Wait for the red BB Analyzer zone to appear on the chart.
- Confirm that price is reacting near the upper Bollinger Band.
- Open a sell trade after the signal candle closes.
Stop Loss
- Place the stop loss slightly below the lower Bollinger Band for buy trades.
- Place the stop loss slightly above the upper Bollinger Band for sell trades.
- Allow extra room during volatile market conditions.
Take Profit
- Target a minimum risk-to-reward ratio of 1.5.
- Scale out profits as price approaches the opposite band.
- Exit early if price loses momentum against the position.
BB Analyzer V2 + Super Scalper Indicator Forex Scalping Strategy
This scalping strategy combines the BB Analyzer V2 Indicator for MT4 and the Super Scalper Indicator for MT4.
With the BB Analyzer V2, you identify the trend direction: when the histogram turns green, it indicates a bullish trend, and when it turns red, it signals a bearish trend.
The Super Scalper Indicator provides precise entry signals via its colored lines: a blue line for a buy signal and a yellow line for a sell signal.
By aligning trend direction with a sharp entry signal, you can scalp small moves with better odds.
This setup is designed for short‑term trades on M5 to M15 charts.
Because scalping demands quick execution, the rules are simple and the focus is on fast entries and exits.
Buy Entry Rules
- Confirm the BB Analyzer V2 histogram has turned green, signaling a bullish trend.
- Wait for the Super Scalper line to turn blue, indicating a buy entry signal.
- Enter a buy trade at the close of the candle that confirms both signals.
- Set a stop loss about 8–12 pips below the recent swing low (adjust according to pair volatility and timeframe).
- Take profit rule: Option A — fixed target of say 15‑20 pips.
- Option B — dynamic: close half the position at +10 pips, move stop to breakeven, then let the remainder run to +25‑30 pips or exit when the line turns yellow (sell) or the BB Analyzer turns red.
Sell Entry Rules
- Confirm the BB Analyzer V2 histogram has turned red, signaling a bearish trend.
- Wait for the Super Scalper line to turn yellow, indicating a sell entry signal.
- Enter a sell trade at the close of the confirming candle.
- Set a stop loss about 8–12 pips above the recent swing high.
- Take profit rule: Option A — fixed target of 15‑20 pips.
- Option B — close half at +10 pips, move stop to breakeven, let the rest run to +25‑30 pips or exit when blue line appears or BB Analyzer turns green.
Advantages
- Combines a trend‑filter (BB Analyzer V2) with a precise entry trigger (Super Scalper), improving the probability of success.
- Scalping timeframe means quick trades, less exposure to overnight risk.
- The dynamic take-profit option allows more flexibility and potential upside while managing risk.
Drawbacks
- High frequency of trades may lead to over‑trading if you don’t stick to rules and skip low‑quality setups.
- Tight stops typical of scalping make you vulnerable to spread widening or slippage, especially with slower brokers.
- Requires full attention while scalping; distractions or slow responses reduce effectiveness.
Case Study 1 – EURUSD (M5 Chart)
In the early London session, EURUSD showed the BB Analyzer histogram turned green.
Shortly afterwards, the Super Scalper line turned blue, signaling buy.
A long position was opened at 1.1050 with a stop loss at 1.1040 (10 pips).
Using the dynamic take profit rule: half closed at +10 pips at 1.1060, stop moved to breakeven, the remainder ran to +25 pips and closed at 1.1075.
The trade delivered +25 pips in about 20 minutes.
Case Study 2 – USDJPY (M15 Chart)
In the New York session, USDJPY showed the Bollinger Bands Analyzer histogram red (bearish trend).
The Super Scalper line turned yellow, indicating a sell entry.
A short was entered at 149.20 with a stop loss at 149.32 (12 pips).
Following the fixed target option, the trade aimed for +20 pips and closed at 149.00.
The move was completed within 30 minutes.
Strategy Tips
- Trade major pairs with low spreads and good liquidity to reduce cost and slippage.
- Avoid trading around major news announcements where sudden spikes and reversals may hurt scalping setups.
- Consider monitoring a higher timeframe (H1 or H4) to ensure you’re trading in the direction of the broader trend, which may help reduce false signals in scalps.
Download Now
Download the “bb-analyzer-v2-indicator.ex4” MT4 indicator
FAQ
What makes BB Analyzer V2 different from standard Bollinger Bands?
It adds colored trading zones that visually highlight potential reversal areas rather than relying only on band touches.
Is the indicator suitable for trending markets?
Yes, but it performs best when used to identify pullbacks and exhaustion points within broader trends.
Can BB Analyzer V2 be used for scalping?
It can be applied to lower timeframes, but traders should adjust risk management carefully due to faster price movement.
Summary
The BB Analyzer V2 Forex Indicator for MT4 offers a visually intuitive way to trade Bollinger Band reversals using colored buy and sell zones.
Its ability to highlight potential turning points helps traders improve timing and decision-making.
With flexible usage, straightforward signals, and compatibility with many trading styles, BB Analyzer V2 is a practical addition for traders who rely on volatility-based strategies.


