
About the UFX Trend Multi Meter Indicator
The UFX Trend Multi Meter Indicator for MT4 is designed to help traders identify trend direction across multiple timeframes in one compact panel.
Instead of switching charts or adding several indicators, this tool summarizes trend conditions in a clear, readable format directly on your chart.
It evaluates price behavior using internal calculations and displays whether the market is bullish, bearish, or neutral on each selected timeframe.
This indicator is especially useful for traders who want to trade in the direction of the dominant trend.
Comparing short-term and higher-timeframe momentum helps filter low-probability setups and avoid countertrend entries.
Scalpers, day traders, and swing traders can all adapt it to their style by adjusting the monitored timeframes.
Free Download
Download the “UFX TREND multiMeter.mq4” indicator for MT4
Key Features
- Checks both H1 and D1 trends at the same time for better accuracy.
- Uses simple color-coded signals that appear directly on your trading chart.
- Saves time by showing multi-timeframe data in one single view.
- Helps filter out “fake” moves that don’t have enough power to last.
- Keeps your trading simple by focusing only on the most important trends.
Indicator Chart
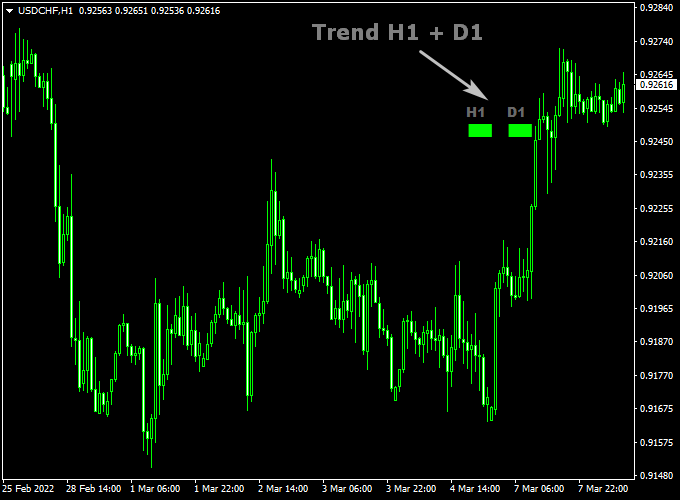
The chart shows how the UFX Trend Multi Meter indicator sits on your main window.
You can see the colored blocks that tell you the trend for the H1 and D1 periods.
When both blocks are the same color, it means the market is in a strong, synchronized move.
Green blocks mean the bulls are in charge, and red blocks mean the bears have control.
Guide to Trade with UFX Trend Multi Meter Indicator
Buy Rules
- Watch the indicator signals on your main chart window.
- Wait until both the H1 and D1 signal blocks turn green.
- Open a buy trade once the candle closes with both signals showing green.
Sell Rules
- Watch the indicator signals on your main chart window.
- Wait until both the H1 and D1 signal blocks turn red.
- Open a sell trade once the candle closes with both signals showing red.
Stop Loss
- For buy trades, place your stop loss just below the last low point.
- For sell trades, place your stop loss just above the last high point.
- Always keep a small gap to protect your trade from normal price wiggles.
Take Profit
- Exit your trade if one of the color blocks changes, showing the trend is fading.
- You can also set a target where you win twice as much as you risked.
- Consider closing the trade if price hits a major level on the daily chart.
UFX Trend Multi Meter + SuperTrend NRP Swing Trading Strategy for MT4
This swing trading strategy combines the UFX Trend Multi Meter Indicator for MT4 with the SuperTrend NRP Forex Indicator for MT4 to capture medium-term trend reversals and ride strong
directional moves.
The method focuses on identifying the overall direction from higher time frames and aligning entries with the main trend using price action confirmation.
It’s ideal for traders who prefer fewer but higher-quality setups on H4 and D1 charts, holding trades for several days.
The UFX Trend Multi Meter provides multi-timeframe analysis, showing whether the H1 and D1 charts are bullish or bearish.
The SuperTrend NRP confirms entries by signaling shifts in momentum through color changes—green for buy and orange for sell.
When both indicators align, traders can confidently enter trades in the direction of the prevailing trend.
Buy Entry Rules
- Wait until both H1 and D1 rectangles on the UFX Trend Multi Meter are green, confirming a bullish trend across time frames.
- Confirm that the SuperTrend NRP line turns green on your chart.
- Enter a buy position on the next candle after confirmation.
- Place your stop loss below the most recent swing low or below the SuperTrend line.
- Take profit when the SuperTrend NRP line turns orange or when the price reaches a strong resistance zone.
Sell Entry Rules
- Wait until both H1 and D1 rectangles on the UFX Trend Multi Meter are red, confirming a bearish trend.
- Confirm that the SuperTrend NRP line turns orange.
- Open a sell position on the next candle after confirmation.
- Set the stop loss above the most recent swing high or above the SuperTrend line.
- Take profit when the SuperTrend NRP line turns green or when the price reaches a key support area.
Advantages
- Combines higher time frame trend confirmation with real-time price action for strong accuracy.
- Filters out noise and false entries common in lower time frames.
- Easy visual setup with clear color-coded trend identification.
- Allows swing traders to hold positions confidently for several days.
Drawbacks
- Fewer trade opportunities compared to scalping or intraday systems.
Case Study 1: EUR/JPY 4-Hour Chart
On EUR/JPY, both H1 and D1 rectangles on the UFX Trend Multi Meter turned green in mid-March.
Shortly after, the SuperTrend NRP shifted from orange to green, confirming a buy setup around 162.40.
The pair rallied steadily to 165.80, delivering around 340 pips in profit within four trading days.
The trade was exited once the SuperTrend turned orange, signaling exhaustion of momentum.
Case Study 2: GBP/USD Daily Chart
In August, GBP/USD displayed red rectangles on both H1 and D1 of the UFX Trend Multi Meter, indicating a bearish market.
The SuperTrend NRP confirmed the sell signal when its line turned orange near 1.2900.
The pair declined strongly to 1.2550 within one week, producing over 400 pips.
The strategy demonstrated clear synchronization between higher time frame momentum and real-time price confirmation.
Strategy Tips
- For swing trading, focus on H4 and D1 charts for confirmation and execution.
- Always check the UFX Trend Multi Meter first before taking trades; alignment between H1 and D1 is key.
- Use trailing stops to lock in profits during strong trending phases.
- Avoid trading during major economic events that could trigger sudden reversals.
- Combine this setup with candlestick confirmation for extra precision at entries.
Download Now
Download the “UFX TREND multiMeter.mq4” indicator for Metatrader 4
FAQ
Why is it important to see the H1 and D1 trends together?
In forex, the daily trend (D1) usually tells you where the market is going over the long term, while the hourly trend (H1) shows what is happening right now.
If you only trade the H1, you might accidentally trade against a massive daily trend.
By seeing both together, you make sure you are moving with the “heavy tide” of the market, which significantly increases your chances of winning.
Can I use this for quick scalping on the 1-minute chart?
Yes, you can. Even if you are trading on very fast charts like the M1 or M5, the UFX Trend Multi Meter will still show you the H1 and D1 trends.
Using it this way ensures that your quick scalps are aligned with the much stronger hourly and daily directions, which helps prevent you from getting caught in sharp reversals.
What does it mean if the colors don’t match?
When the colors are different, it means the market is confused or starting to change direction.
For example, if the D1 is green but the H1 is red, it means the long-term trend is up, but price is currently falling.
In these cases, it is usually smartest to wait until the colors match again before putting your money at risk.
Summary
The UFX Trend Multi Meter indicator is a fantastic addition for any trader who wants to trade with the trend without overcomplicating their charts.
It takes the guesswork out of technical analysis by providing clear, visual signals based on two of the most important timeframes in the market.
By following its simple color system, you can ensure that you are always on the right side of the market’s momentum.
While no tool is perfect, this indicator helps build the discipline needed to wait for the best setups.
It is easy to understand, easy to use, and works well for many different trading styles.


