
About the SwingMan Ultra Super Forex Indicator
The SwingMan Ultra Super Forex Indicator is designed for MetaTrader 4 traders who rely on momentum and trend timing.
It uses a TRIX-based oscillator to track shifts in market direction and highlight trade opportunities as they develop.
The indicator runs in a separate MT4 window and displays a colored histogram that reacts to changes in momentum.
When price action strengthens, the histogram expands and changes color. This helps traders stay aligned with the dominant move instead of guessing reversals.
What makes this tool practical is the arrow system.
A buy or sell arrow appears on the chart when the oscillator crosses the 0.00 neutral level.
These crossings often signal a potential change in trend or a continuation entry after consolidation.
It works best in trending markets where momentum shifts matter more than noise.
Free Download
Download the “Swingman ultrasuper trix.ex4” indicator for MT4
Key Features
- TRIX-based oscillator for momentum and trend analysis.
- Separate MT4 window with a colored histogram.
- Automatic buy and sell arrows on zero-line crossings.
- Blue arrows indicate bullish momentum shifts.
- Red arrows indicate bearish momentum shifts.
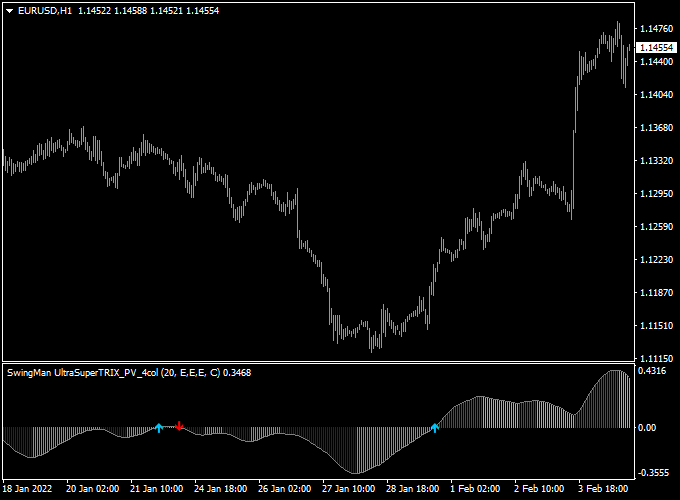
Indicator Chart
The chart displays the histogram below the price along with blue and red arrows on the main chart.
Blue arrows mark buy signals when momentum turns bullish. Red arrows mark sell signals when momentum turns bearish.
Guide to Trade with SwingMan Ultra Super Forex Indicator
Buy Rules
- Wait for the histogram to move above the 0.00 neutral level.
- Confirm that a blue buy arrow appears on the price chart.
- Enter a buy position once the signal candle closes.
Sell Rules
- Wait for the histogram to drop below the 0.00 neutral level.
- Confirm that a red sell arrow appears on the price chart.
- Enter a sell position once the signal candle closes.
Stop Loss
- Place the stop loss a few pips beyond the nearest support level for buy trades.
- Place the stop loss a few pips beyond the nearest resistance level for sell trades.
Take Profit
- Set take profit based on recent price swings in the direction of the trade.
- Another option is to exit when the histogram approaches the zero level again.
SwingMan Ultra TRIX + Best Forex Scalping Indicator MT4 Strategy
This strategy uses the SwingMan Ultra Super Forex Indicator for MT4 and the Best Forex Scalping Indicator for MT4.
It is built for very short-term trades on M1 and M5 charts, specifically for scalpers who want quick entries and exits.
The first indicator gives trend arrows: a blue arrow signals a buy trend, a red arrow signals a sell trend.
The second indicator gives immediate entry signals: blue arrow = buy signal, red arrow = sell signal.
By combining them, you get trend direction from the first and precise entry timing from the second.
It works best during active sessions such as the London or New York session when price action is fast and clear.
Buy Entry Rules
- Wait until the SwingMan Ultra indicator prints a blue arrow, indicating a buy trend.
- Once the trend is confirmed by the blue arrow, wait for the Best Forex Scalping indicator to show a blue arrow (buy signal).
- Enter a buy trade on the closing of the signal candle immediately after the second blue arrow appears.
- Set a stop loss just below the recent swing low (for M5 maybe 10-15 pips, for M1 maybe 5-8 pips depending on pair/spread).
- Set a take profit at 1.5× or 2× the stop loss amount
- Or exit when either indicator gives a reversal arrow (SwingMan prints red or the Scalping indicator prints red).
Sell Entry Rules
- Wait until the SwingMan Ultra indicator prints a red arrow, indicating a sell trend.
- Once you have the red trend arrow, wait for the Best Forex Scalping indicator to give a red arrow (sell signal).
- Enter a sell trade on the closing of the signal candle after the red arrow from the second indicator.
- Place the stop loss just above the recent swing high (for M5, maybe 10-15 pips, for M,1, maybe 5-8 pips).
- Set the take profit at ~1.5× or ~2× the stop loss
- Or exit when a blue arrow appears on either indicator.
Advantages
- You trade in the direction of the trend (via SwingMan Ultra), improving the probability of success.
- The second indicator gives clear entry signals that reduce hesitation.
- Designed specifically for M1/M5 charts—so you can do multiple trades in a session.
- Risk is limited by defined stop losses and profit targets.
- Visual and simple: easy to follow, even when speed is required.
Drawbacks
- In very choppy or range-bound markets, the arrows may flip frequently, leading to losses.
- The strategy requires very quick decisions and constant monitoring—scalping is intensive.
- High spread or slow execution can eat into profits on M1 or M5 timeframes. Choose a fast broker.
Example Case Study 1 – EURUSD M1
On the EURUSD M1 chart during the London session, the SwingMan Ultra printed a blue arrow at 1.10950, indicating a buy trend.
A few seconds later, the Best Forex Scalping indicator printed a blue arrow at 1.10955.
A buy trade was entered at 1.10956 with a 6-pip stop loss (1.10950-1.10944) and a take profit target of ~10-12 pips.
Within 8 minutes price climbed to 1.10966, profit taken.
The trend arrow (SwingMan) stayed blue during the move, giving confidence.
Example Case Study 2 – GBPJPY M5
On the GBPJPY M5 chart, just after New York open, the SwingMan Ultra printed a red arrow at 150.45, signifying a sell trend.
The Best Forex Scalping indicator then printed a red arrow at 150.42.
A sell trade was entered at 150.40 with a stop loss of 12 pips at 150.52 and a target of ~20-24 pips.
Within 15 minutes, the price fell to 150.18, yielding 22 pips.
The trend arrow remained red throughout.
Strategy Tips
- Use major pairs (EURUSD, GBPUSD, USDJPY, GBPJPY) to ensure tighter spreads and better scalping potential.
- Keep risk per trade small relative to account size (for example, 0.5-1% per trade) because scalping creates many trades.
- If you get a signal but the price is right at a strong support/resistance or a big round level, either skip or tighten the stop loss because reversal risk is higher.
- Monitor execution speed and spread: if the spread widens unexpectedly or slippage occurs, skip the trade.
Download Now
Download the “Swingman ultrasuper trix.ex4” indicator for Metatrader 4
FAQ
How does the SwingMan Ultra Super Forex Indicator generate trade signals?
The indicator uses a TRIX-based oscillator and prints signals when momentum crosses the 0.00 neutral level.
A blue arrow signals bullish momentum, while a red arrow signals bearish momentum.
Are the buy and sell arrows repainting?
The arrows appear only after a candle closes and the histogram confirms a zero-line crossover. Once plotted, the signals do not change.
Can the indicator be combined with other tools?
Yes, it works well alongside support and resistance analysis or trend filters. This helps avoid trades during low-momentum or ranging conditions.
Summary
The SwingMan Ultra Super Forex Indicator offers a practical way to trade momentum using TRIX-based signals.
The histogram gives a steady view of trend strength, while the arrows highlight actionable entry points.
Its simple layout makes it easy to read, even during fast market moves.
Traders can improve performance by pairing it with basic market context and disciplined risk management.


