About the Adaptive Moving Average Indicator
The Adaptive Moving Average indicator for MT5 is a trend-following tool designed to adapt to changing market conditions.
Unlike traditional moving averages that use fixed calculations, this indicator adjusts its responsiveness depending on price movement and volatility.
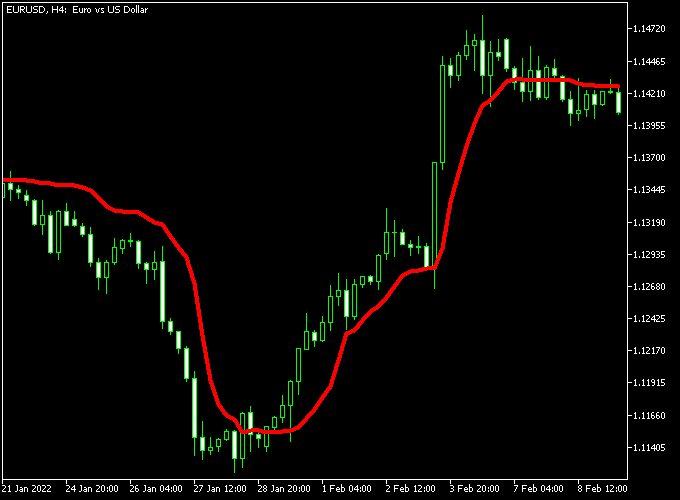
The indicator appears directly on the price area as a red line that follows the market trend.
When the line begins moving upward, it reflects increasing bullish momentum. When the line slopes downward, it indicates growing bearish pressure.
Because the calculation adapts to market behavior, the indicator reacts more quickly during strong trends and slows down during sideways conditions.
This makes it useful for traders who want to track the dominant market direction without constant signal noise.
Some traders also apply two Adaptive Moving Average lines with different periods.
This approach creates a crossover method where one line reacts faster than the other, producing potential entry signals when the lines cross.
Free Download
adaptive-moving-average.mq5 (MT5)
Key Features
- Adaptive moving average that reacts to changing market volatility.
- Helps traders identify the prevailing market direction.
- Works on all forex pairs including majors, minors, and exotic pairs.
- Can be combined with a second adaptive average for crossover strategies.
Indicator Chart
The Adaptive Moving Average Indicator appears on the price area as a red line that follows the direction of the market.
When the line slopes upward it reflects bullish momentum, while a downward slope signals bearish movement.
Guide to Trade with the Adaptive Moving Average Indicator
Buy Rules
- Add two Adaptive Moving Average indicators with different periods.
- Wait for the faster moving average to cross above the slower one.
- Confirm that both lines begin moving upward.
- Open a buy trade after the crossover is established.
Sell Rules
- Use two Adaptive Moving Average indicators with different settings.
- Wait for the faster moving average to cross below the slower one.
- Confirm that both lines start pointing downward.
- Open a sell trade once the crossover appears.
Stop Loss
- Place the stop loss below the most recent swing low for buy trades.
- Place the stop loss above the most recent swing high for sell trades.
- Allow enough distance to avoid being stopped out by minor fluctuations.
Take Profit
- Close the buy trade if the fast moving average crosses back below the slow line.
- Close the sell trade if the fast moving average crosses back above the slow line.
- Alternatively, target previous market highs or lows.
- Some traders scale out of positions as the trend progresses.
Adaptive Moving Average MT5 and Range Expansion Index Trading Strategy
This trading strategy combines the Adaptive Moving Average Indicator with the Range Expansion Index Indicator to create a simple system that follows trend direction while timing entries based on momentum expansion.
The Adaptive Moving Average adjusts its sensitivity based on market conditions.
When price is above the MA and the line is sloping upward, it signals a bullish trend with sustained buying pressure.
When price is below the MA and the line slopes downward, it signals a bearish trend with continued selling pressure.
The Range Expansion Index measures momentum acceleration and market expansion.
When the histogram moves above zero, it signals a buy entry and confirms upward expansion.
When it drops below zero, it signals a sell entry and confirms downward pressure.
This strategy works best on M15 and H1 charts where trends develop with enough structure while still offering multiple intraday opportunities.
Buy Entry Rules
- Wait for price to be above the Adaptive Moving Average with an upward slope.
- Confirm that the AMA is acting as dynamic support.
- Wait for the Range Expansion Index histogram to cross above zero.
- Enter a buy trade at the close of the confirmation candle.
- Place a stop loss below the recent swing low or just below the AMA line.
- Take profit when the histogram drops below zero or when price breaks below the AMA.
Sell Entry Rules
- Wait for price to be below the Adaptive Moving Average with a downward slope.
- Confirm that the AMA is acting as dynamic resistance.
- Wait for the Range Expansion Index histogram to cross below zero.
- Enter a sell trade at the close of the confirmation candle.
- Set the stop loss above the recent swing high or just above the AMA line.
- Take profit when the histogram crosses above zero or when price breaks above the AMA.
Case Study 1: EURUSD M15 Buy Setup
On EURUSD M15, price moved above the Adaptive Moving Average and the line started sloping upward, showing that bullish structure was forming after a consolidation phase.
After a minor pullback toward the moving average, price held above it and continued respecting it as dynamic support.
The Range Expansion Index then crossed above zero, confirming renewed bullish momentum.
A buy trade was entered at the close of the signal candle after both trend and momentum aligned.
The stop loss was placed just below the Adaptive Moving Average and under the most recent swing low to avoid premature exit from normal pullbacks.
Price continued upward in steady waves and the trade was closed when the Range Expansion Index dropped back below zero, signaling a slowdown in upward expansion.
Case Study 2: GBPJPY H1 Sell Setup
On GBPJPY H1, price fell below the Adaptive Moving Average and the line began sloping downward, confirming a bearish market structure.
After a brief retracement toward the MA, price rejected the area and remained below it.
The Range Expansion Index then crossed below zero, confirming bearish momentum expansion.
A sell trade was entered at the close of the confirmation candle once both indicators aligned in the same direction.
The stop loss was placed above the Adaptive Moving Average and slightly above the recent swing high to allow for volatility during pullbacks.
Price moved downward in structured legs and the trade was closed when the Range Expansion Index crossed back above zero, signaling weakening bearish momentum.
Download Now
adaptive-moving-average.mq5 (MT5)
FAQ
What makes the Adaptive Moving Average different from a regular moving average?
The adaptive version changes its sensitivity based on market volatility.
It reacts faster during strong trends and slows down during quieter market periods.
Why do traders use two adaptive moving averages?
Using two averages with different periods creates a crossover system.
When the faster line crosses the slower one, it can indicate a potential shift in momentum.
Can the indicator be used with other tools?
Yes. Traders often combine it with support and resistance levels, momentum indicators, or price action patterns to confirm trend direction.
Summary
The Adaptive Moving Average Indicator provides a responsive way to track the prevailing market trend.
Its calculation adjusts to market volatility, allowing it to react differently during strong movements and slower conditions.
The indicator is simple to read and can be used as a standalone trend guide or as part of a crossover system when two averages are applied.
This flexibility makes it suitable for different trading approaches.