
About the Stealth Trend Forex Indicator
The Stealth Trend Forex indicator for Metatrader 4 provides high-probability trend trading signals and works for trade entries and exits across all asset classes.
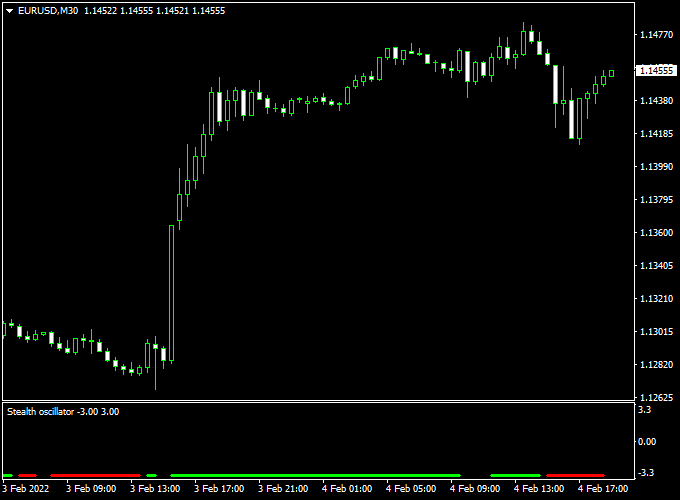
The indicator pops up in a separate MT4 chart window as green and red trend bars, creating a visual “at-a-glance” system for identifying market sentiment.
The Stealth indicator is a very reliable technical oscillator, lightweight, and will not slow down your trading platform, making it a dependable choice for those who trade multiple pairs simultaneously.
Because it provides such definitive signals, it is often used by traders who want to simplify their decision-making process during fast-moving market sessions.
Free Download
Download the “Stealth oscillator.mq4” indicator for MT4
Key Features
- It utilizes a color-coded bar system to provide instant confirmation of trend transitions.
- The indicator focuses on high-probability setups by filtering out low-volume market noise.
- The tool is effective for both identifying new entries and determining logical exit points.
- It works seamlessly across all timeframes, from 1-minute scalping to weekly swing trading.
- The sub-window placement ensures the main price chart remains clean for additional analysis.
Indicator Chart
The Stealth Trend indicator chart features a dedicated window below the main price action where a series of vertical bars are displayed.
When the bars turn green, it indicates a bullish environment where buyers are in control of the momentum.
When the bars shift to red, it signifies a bearish environment where sellers are pushing the price lower.
By watching the bars flip between these two colors, a trader can easily pinpoint the birth of a new trend.
Guide to Trade with Stealth Trend Forex Indicator
Trading with this tool involves monitoring the histogram for a color change to ensure you are always aligned with the current market bias.
Buy Rules
- Monitor the indicator window for the moment the red bars transition into green bars.
- Open a long trade as soon as the Stealth indicator starts painting the green colored trend bar.
- Confirm the signal by ensuring the price is holding above a recent support level on the main chart.
- Wait for the current candle to close to ensure the green signal is fully locked in.
Sell Rules
- Watch for the moment the green momentum cycle concludes and a red bar appears.
- Open a short trade as soon as the Stealth indicator starts painting the red colored trend bar.
- Verify the entry by checking for a bearish rejection pattern on the main price chart.
- Ensure the broader market trend on a higher timeframe aligns with the bearish signal.
Stop Loss
- Secure your long position by placing the stop loss a few pips below the most recent swing low.
- Protect your short trade by positioning the stop loss slightly above the latest swing high.
- Adjust your stop placement based on the current volatility of the chosen currency pair.
- Always follow a fixed risk management plan to protect your trading equity.
Take Profit
- Exit the trade as soon as the Stealth indicator paints a bar of the opposite color.
- Target a 1:2 risk-to-reward ratio to maintain a positive statistical edge over time.
- Consider closing the position if the price reaches a major historical resistance or support zone.
- You can also trail your stop loss to lock in gains as the trend continues to extend.
Stealth Trend + MA Trend Dashboard Forex Day Trading Strategy
This day trading strategy combines the Stealth Trend Forex Indicator MT4 and the Moving Average Trend Dashboard MT4.
The Stealth Trend indicator provides real-time trend bars: green bars signal bullish momentum, while red bars indicate bearish momentum.
The MA Trend Dashboard consolidates multiple time frames and shows buy trends when most time frames display blue arrows and sell trends when most display red arrows.
Using both indicators together allows traders to enter trades aligned with intraday momentum and broader trend direction.
This strategy is designed for day trading on M5, M15, and M30 charts.
It is suitable for all currency pairs but works best on majors with good liquidity, such as EURUSD, GBPUSD, and USDJPY.
Buy Entry Rules
- Check that the MA Trend Dashboard shows a majority of blue arrows across multiple time frames, indicating an overall bullish trend.
- Wait for the Stealth Trend indicator to start painting a green trend bar on your selected chart.
- Enter a long trade at the close of the first green bar.
- Place a stop loss below the recent swing low or a nearby support level.
- Take profit targets: 15–30 pips on M5, 25–40 pips on M15, and 40–60 pips on M30 charts.
Sell Entry Rules
- Check that the MA Trend Dashboard shows a majority of red arrows across multiple time frames, indicating an overall bearish trend.
- Wait for the Stealth Trend indicator to start painting a red trend bar on your chart.
- Enter a short trade at the close of the first red bar.
- Place a stop loss above the recent swing high or a nearby resistance level.
- Take profit targets: 15–30 pips on M5, 25–40 pips on M15, and 40–60 pips on M30 charts.
Advantages
- Combines momentum and multi-time frame trend confirmation for higher probability trades.
- Applicable to multiple time frames and currency pairs for flexible trading.
- Helps avoid counter-trend trades by requiring trend alignment across multiple time frames.
- Supports disciplined stop loss and take profit levels for intraday trading.
Drawbacks
- Trend confirmation from multiple time frames may delay entries in fast markets.
- Stop losses may be hit during brief retracements before trend continuation.
Case Study 1: EURUSD M15 – London Session
During the London session, the MA Trend Dashboard showed the majority of time frames with blue arrows, confirming a bullish trend.
The Stealth Trend indicator printed a green bar at 1.1023.
A buy trade was entered with a stop loss at 1.1010.
Price rose to 1.1052 within 45 minutes, yielding a 29-pip profit.
The combination of trend confirmation and momentum indicator improved trade accuracy.
Case Study 2: GBPUSD M5 – New York Session
GBPUSD on the M5 chart displayed the MA Trend Dashboard with most time frames showing red arrows, signaling a bearish trend.
The Stealth Trend indicator painted a red bar at 1.2785.
A sell trade was entered with a stop loss at 1.2795.
Price declined to 1.2758 in 35 minutes, resulting in 27 pips profit.
Strategy Tips
- Trade only when both the Stealth Trend indicator and the MA Trend Dashboard align.
- Avoid trading in choppy or range-bound markets where trend signals frequently flip.
- Adjust take profit and stop loss according to the chart time frame and market volatility.
- Focus on major currency pairs with high liquidity for more reliable signals.
- Maintain consistent risk management, keeping risk per trade between 1–2% of account balance.
Download Now
Download the “Stealth oscillator.mq4” indicator for Metatrader 4
FAQ
How does this indicator handle ranging markets?
In a sideways or ranging market, the bars may change color more frequently.
To filter out these less reliable signals, many traders wait for the bars to gain height, which indicates that the trend is actually gaining momentum.
Combining the Stealth Trend with a volume indicator can also help you avoid entering trades when the market lacks the conviction to move.
Can I use the Stealth Trend for scalping?
Yes, the Stealth Trend is highly responsive on lower timeframes like the M1 and M5.
It helps scalpers identify quick bursts of momentum during the London and New York overlaps.
For the best results, look for signals that occur during peak trading hours when liquidity is high and the trends are more likely to have significant follow-through.
Summary
The Stealth Trend for MT4 is an effective momentum tool that assists in determining the appropriate timing for market entries.
By offering a visual representation of trend strength, it helps you avoid the common trap of trading against a powerful market force.
This tool helps traders maintain a consistent routine by highlighting levels where the market is statistically likely to continue its path.
Using this indicator allows you to filter high-risk trades and focus on high-conviction momentum shifts.


