About the OsMACD Forex Indicator
The OsMACD Forex Indicator for MT4 is a directional trend oscillator designed to identify momentum shifts and sustained price movement.
It is based on the OsMACD concept, which measures the relationship between a moving average convergence system and its signal line.
This allows traders to track trend strength with more sensitivity than traditional MACD tools.
Instead of cluttering the chart, the indicator is displayed in a separate window as a colored histogram.
These bars reflect the dominant market direction and help traders recognize when momentum begins to build or fade.
By focusing on directional bias, OsMACD supports both trend continuation trades and early entries after momentum transitions.
It can be traded as a standalone system or combined with price action, support and resistance, or higher-timeframe trend analysis.
Free Download
Download the “OsMACD.mq4” indicator for MT4
Key Features
- Directional trend histogram based on OsMACD calculations.
- Color-coded bars that reflect bullish and bearish momentum.
- Signals form around the 0.00 level for easy interpretation.
- Useful for trend trading, scalping, and intraday strategies.
- Compatible with all MT4 currency pairs and time frames.
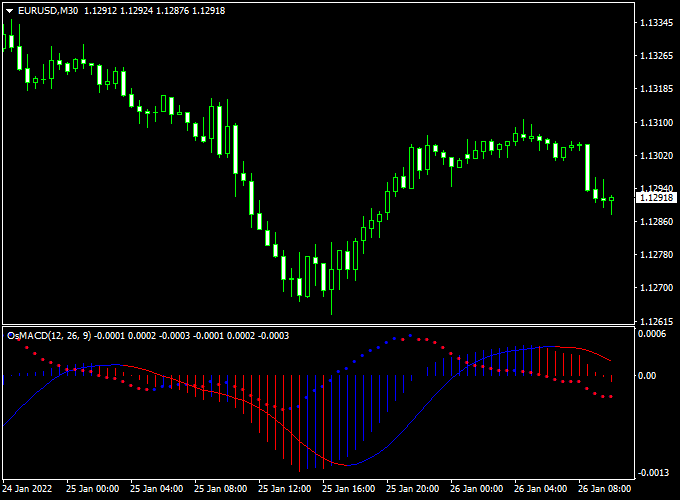
Indicator Chart
The OsMACD Forex Indicator chart displays a colored histogram in a sub-window below the price.
Blue bars above the 0.00 level indicate growing bullish momentum.
Red bars below the 0.00 level show increasing bearish pressure.
This layout helps traders stay aligned with the dominant trend while avoiding low-momentum conditions.
Guide to Trade with the OsMACD Forex Indicator
Buy Rules
- Open a buy trade when the first blue histogram bar forms above the 0.00 level.
- Confirm the setup when additional blue bars continue to print.
- Avoid long entries when bars fluctuate tightly around the zero line.
Sell Rules
- Open a sell trade when the first red histogram bar appears below the 0.00 level.
- Look for follow-through with consecutive red bars.
- Avoid short entries when bars fluctuate tightly around the zero line.
Stop Loss
- Place the stop beyond the most recent swing structure on the price chart.
- Exit the trade if the histogram flips to the opposite color.
Take Profit
- Target nearby support or resistance zones for realistic exits.
- Hold the position while the histogram remains consistent in color.
OsMACD + 5 MAs Signal Forex Swing Trading Strategy
This swing trading strategy combines the OsMACD Forex indicator and the 5 MAs Signal indicator to identify medium-term trades in trending markets.
OsMACD, a variation of the MACD, shows histogram bars that reflect momentum strength—crossing above the zero level indicates bullish momentum, while crossing below it signals bearish momentum.
The 5 MAs Signal indicator uses the classic 50- and 200-period moving averages to detect long-term trend direction through their crossover.
The combination works well for swing trading because it filters out short-term noise.
You wait for the moving averages to confirm the overall trend, then use OsMACD zero-line crossovers to time entries.
The system is best applied on H1, H4, and D1 charts across major pairs such as EURUSD, GBPJPY, USDCHF, and AUDUSD.
Buy Entry Rules
- Wait for the 50-period moving average to cross above the 200-period moving average on the 5 MAs Signal indicator. This confirms a bullish trend.
- Once the bullish crossover occurs, monitor the OsMACD indicator.
- Enter a buy position when the OsMACD histogram crosses above the zero level, showing bullish momentum.
- Stop loss: place below the recent swing low or 1.5× the ATR value at entry time.
- Take profit: aim for 2× your risk, or exit when OsMACD crosses back below zero or the 50 MA crosses back under the 200 MA.
Sell Entry Rules
- Wait for the 50-period moving average to cross below the 200-period moving average, indicating a bearish trend.
- Once the bearish crossover forms, observe OsMACD for confirmation.
- Enter a sell trade when the OsMACD histogram crosses below the zero level, signaling downside momentum.
- Stop loss: place above the most recent swing high or 1.5× the ATR.
- Take profit: target at least 2× risk, or close the trade when OsMACD crosses back above zero or the 50 MA crosses above 200 MA again.
Advantages
- Combines long-term trend direction with short-term momentum confirmation for cleaner swing setups.
- Reduces false signals by requiring both a moving average crossover and a momentum shift.
- Suitable for higher timeframes (H1, H4, D1) — fewer trades but higher accuracy.
- Offers clear visual entries and exits with minimal discretionary judgment.
Drawbacks
- The MA crossover can lag, causing late entries after a trend has already begun.
- OsMACD crossovers may produce false signals in sideways markets.
- Performance can drop when the price oscillates around the moving averages.
- Requires patience, as strong signals may appear only a few times per week.
Case Study 1: EURUSD H4
On the EURUSD H4 chart, the 50 MA crossed above the 200 MA, confirming a new bullish phase.
A few candles later, the OsMACD histogram crossed above zero at 1.0760.
A buy was opened with a stop at 1.0705 (55 pips).
Price trended higher, reaching 1.0870 within three days.
The trade yielded around 110 pips, a 2× reward-to-risk ratio. The OsMACD remained positive throughout the move.
Case Study 2: GBPJPY Daily
In a bearish phase, the 50 MA crossed below the 200 MA.
The OsMACD histogram soon crossed under zero near 184.20, prompting a sell.
Stop loss was set at 185.50 (130 pips).
Within four days, GBPJPY dropped to 182.00, hitting the 2× risk target for a 260-pip profit.
The OsMACD stayed negative until the exit point, validating the trade’s direction.
Strategy Tips
- Use the H4 or D1 chart for clean trends and stronger swing potential.
- Wait for both indicators to align — MA crossover first, then OsMACD momentum shift.
- Avoid trading when the 50 and 200 MAs are flat and close together, as that signals consolidation.
- Combine with price action or support/resistance zones to confirm entry areas.
- Consider scaling out partial profits when the price moves 1× your risk to secure gains.
- Backtest with different pairs to find which ones trend best with this setup
Download Now
Download the “OsMACD.mq4” indicator for Metatrader 4
FAQ
What type of trader is OsMACD best suited for?
OsMACD is highly effective for traders who focus on directional momentum.
It works particularly well for trend-following and intraday strategies.
Does the indicator repaint?
The histogram reflects live momentum changes and does not repaint past bars.
Signals form based on confirmed price data.
Can OsMACD be combined with other indicators?
Yes, it pairs well with support and resistance levels or higher-timeframe filters.
This can help improve trade selection and timing.
Summary
The OsMACD Forex Indicator for MT4 offers a practical way to follow market direction through momentum-based histogram signals.
Its focus on the zero line makes trend changes easy to interpret and trade.
By simplifying directional analysis, the indicator helps traders stay aligned with stronger market moves.
OsMACD is flexible, easy to read, and suitable for a wide range of trading styles.
With disciplined execution and proper risk control, it can become a valuable component of a consistent MT4 trading approach.


