
About the Linear Regression Channel Breakout Indicator
The Linear Regression Channel Breakout indicator for MT4 (Metatrader 4) provides buy and sell signals based on the linear regression trading method.
Displayed in the main MT4 chart window, the indicator uses two channel lines to define breakout zones.
When price crosses these lines, the indicator generates colored arrows to signal potential entry points.
Yellow arrows indicate buy signals, while magenta arrows indicate sell signals, providing a simple, visual guide for action.
By using breakout signals in combination with trend confirmation or support/resistance analysis, traders can improve trade timing and increase confidence in entries.
Free Download
Download the “linear regression channel breakout.mq4” indicator for MT4
Key Features
- Generates clear buy and sell signals using the linear regression breakout method
- Displays signal arrows directly on the MT4 chart
- Uses two channel lines to define breakout zones
- Yellow arrows for buy signals, magenta arrows for sell signals
- Helps traders spot breakout opportunities without complex analysis
Indicator Chart
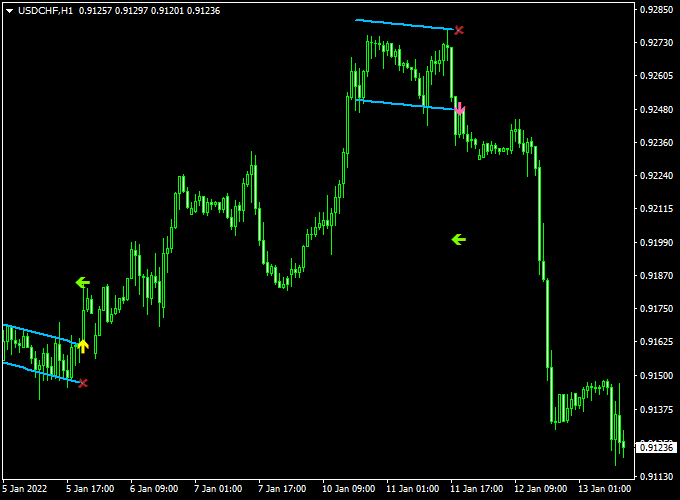
The chart example shows the Linear Regression Channel Breakout Indicator in action on an MT4 price chart.
Yellow arrows mark buy signals and magenta arrows mark sell signals as the price breaks the channel boundaries.
Following these signals along with the market trend improves trade clarity and execution.
Guide to Trade with Linear Regression Channel Breakout Indicator
Buy Rules
- Enter a buy trade when a yellow arrow appears on the chart
- Consider momentum or support levels to validate the breakout
Sell Rules
- Enter a sell trade when a magenta arrow appears on the chart
- Check for nearby resistance to improve trade probability
Stop Loss
- Place a stop loss below the breakout channel line for buy trades
- Place a stop loss above the breakout channel line for sell trades
- Adjust stop distance based on volatility or nearby technical levels
Take Profit
- Target key support/resistance or the opposite channel boundary
- Scale out partial profits near strong reaction zones
- Let trades run if trend strength remains intact and channel slope is favorable
Practical Tips
- Use the indicator alongside trend confirmation for higher accuracy
- Monitor price reaction near the channel lines before entry
MT4 Scalping Strategy Using Linear Regression Channel Breakout and ZWinner Trend Indicator
This MT4 scalping strategy combines the signal precision of the Linear Regression Channel Breakout Indicator with the trend-confirming power of the ZWinner Trend Indicator.
The strategy is ideal for traders looking to capture short-term movements in volatile currency pairs.
It works best on 1-minute to 5-minute timeframes.
By combining breakout signals with trend confirmation, traders can increase the probability of successful entries while minimizing false signals.
The first indicator uses a yellow arrow for buy signals and a magenta arrow for sell signals, while the second indicator shows a green histogram for bullish trends and a red histogram for bearish trends.
Buy Entry Rules
- Wait for a yellow arrow from the Linear Regression Channel Breakout Indicator, signaling a buy opportunity.
- Confirm the trade with a green histogram on the ZWinner Trend Indicator, indicating a bullish trend.
- Enter a buy trade at the market price once both conditions are met.
- Set a stop loss just below the recent swing low or channel boundary.
- Set a take profit at a reasonable level based on the timeframe and market volatility, or near the next resistance.
Sell Entry Rules
- Wait for a magenta arrow from the Linear Regression Channel Breakout Indicator, signaling a sell opportunity.
- Confirm the trade with a red histogram on the ZWinner Trend Indicator, indicating a bearish trend.
- Enter a sell trade at the market price once both conditions are met.
- Set a stop loss just above the recent swing high or channel boundary.
- Set a take profit at a reasonable level based on the timeframe and market volatility, or near the next support.
Advantages
- Combines breakout signals with trend confirmation for higher accuracy.
- Works effectively on short timeframes for scalping multiple trades per session.
- Visual signals are easy to interpret, reducing decision-making time.
- Suitable for various currency pairs, including AUD/USD, USD/CHF, and EUR/JPY.
Drawbacks
- Scalping on very short timeframes can be mentally exhausting and stressful.
- Indicator signals may lag slightly in extremely fast-moving markets, resulting in delayed entries.
- Whipsaw movements can trigger stop losses quickly, especially during low liquidity periods.
- Requires discipline to stick to the strategy and avoid chasing trades outside of confirmed signals.
- Frequent trading can increase transaction costs, especially with brokers that have higher spreads or commissions.
Case Study 1: AUD/USD on 1-Minute Chart
On the AUD/USD 1-minute chart, a yellow arrow appeared from the Linear Regression Channel Breakout Indicator, signaling a buy entry.
The ZWinner Trend Indicator displayed a green histogram, confirming a bullish trend.
The trade was entered at 0.6750, with a stop loss at 0.6745 and a take profit at 0.6760.
The trade closed successfully with a 10-pip gain within 5 minutes.
Case Study 2: USD/CHF on 5-Minute Chart
On the USD/CHF 5-minute chart, a magenta arrow from the Linear Regression Channel Breakout Indicator signaled a sell opportunity.
The ZWinner Trend Indicator showed a red histogram, confirming the bearish trend.
The trade was entered at 0.9050, with a stop loss at 0.9060 and a take profit at 0.9035.
The trade reached the take profit target, netting 15 pips in 10 minutes.
Strategy Tips
- Wait for confirmation from both indicators to avoid false breakouts.
- Use recent swing highs and lows or channel boundaries to set stop loss and take profit levels.
- Adjust take profit levels based on the volatility of the selected currency pair.
- Monitor news and high-impact events that can affect short-term price action.
Download Now
Download the “linear regression channel breakout.mq4” indicator for Metatrader 4
FAQ
How are the signals generated?
Signals are generated when price breaks the defined linear regression channel lines.
Yellow arrows indicate bullish breakouts, and magenta arrows indicate bearish breakouts.
Can this indicator be used for trend confirmation?
Yes. Observing the channel slope alongside breakout signals helps confirm trend direction and improve trade quality.
Does it repaint?
The breakout arrows appear when price crosses the channel lines and do not repaint.
Future price may create new signals, but past signals remain fixed.
Summary
The Linear Regression Channel Breakout Indicator for MT4 provides clear, actionable buy and sell signals based on channel breakouts.
By combining linear regression with visual breakout arrows, traders can easily identify potential entries in trending or volatile markets.
The indicator is suitable for all timeframes and currency pairs and helps simplify trade decisions.
Using it alongside trend confirmation or support/resistance analysis further improves accuracy and confidence.
Watching price behavior near the breakout channel lines allows traders to spot high-probability entries, manage stop loss and take profit levels efficiently, and maintain disciplined trading aligned with market trends.


