
About the Swing Level Forex Indicator
The Swing Level Forex Indicator for Metatrader 4 helps traders identify important swing high and swing low levels directly on the price chart.
These swing points often behave as natural support and resistance where price tends to slow down, react, or reverse.
By detecting these levels automatically, the indicator removes the need for manual analysis and keeps trading decisions consistent.
The indicator is displayed in the main MT4 chart window using colored lines.
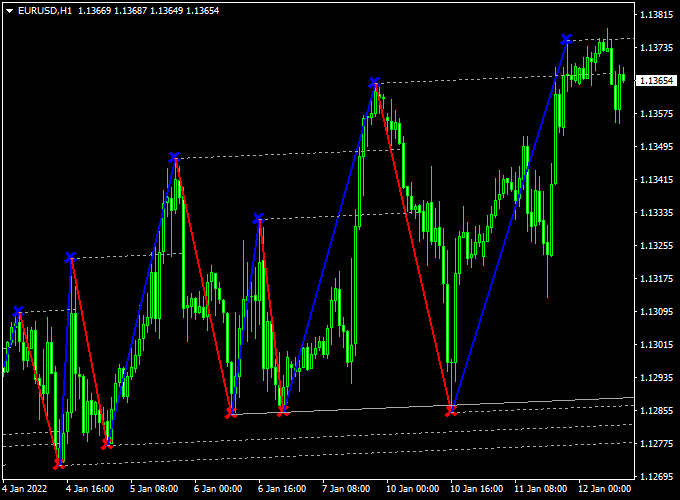
Blue lines connect bullish swing highs, while red lines connect bearish swing lows.
As price interacts with these levels, traders can spot breakout opportunities, trend continuation setups, or areas where price may stall.
It allows traders to focus on price behavior rather than lagging signals, making it suitable for traders who prefer clean charts and level-based decision making.
Free Download
Download the “Level_Trading.mq4” indicator for MT4
Key Features
- Automatically identifies swing high and swing low levels
- Displays support and resistance directly on the chart
- Uses blue and red lines to reflect market direction
- Works on all MT4 timeframes and currency pairs
- Helps with entries, exits, and trade management
- Updates dynamically as new swings form
Indicator Chart
The chart example shows the Swing Level Forex Indicator applied to an MT4 price chart.
Blue and red lines highlight recent swing levels, allowing traders to see where price previously turned or accelerated.
Breaks above or below these levels often signal fresh momentum.
Guide to Trade with Swing Level Forex Indicator
Buy Rules
- Identify the most recent swing high marked by the indicator
- Wait for the price to break and close above the swing high level
- Enter a buy trade after the candle close confirms the breakout
Sell Rules
- Identify the most recent swing low marked by the indicator
- Wait for the price to break and close below the swing low level
- Enter a sell trade after the candle close confirms the breakdown
Stop Loss
- Place the stop loss below the previous swing low for buy trades
- Place the stop loss above the previous swing high for sell trades
- Avoid placing stops too close to the swing level
Take Profit
- Set the first target near the next opposite swing level
- Use higher timeframe swing levels for extended targets
- Consider partial profit taking as price approaches resistance or support
Practical Tips
- Focus on swing level breakouts that align with the higher timeframe trend
- Avoid trading during low-volume or sideways market conditions
- Wait for candle close confirmation to reduce false breakouts
- Combine the indicator with a trend filter such as the Forex Trend Display Indicator
Swing Level + Super Trend Oscillator Swing Trading Strategy for MT4
The combination of the Swing Level Forex Indicator and the Super Trend Forex Oscillator Indicator forms a powerful MT4 swing trading strategy designed to catch large market moves with clear confirmation.
This setup helps traders identify potential breakout points while ensuring that trades are placed in the direction of the prevailing market trend.
The Swing Level indicator defines the key swing highs and lows on the chart.
When the price breaks above a previous swing high, it signals a continuation of a bullish phase.
Conversely, a close below a prior swing low indicates that sellers are taking control.
The Super Trend Oscillator then confirms the direction of the dominant market momentum with its color-coded histogram — blue for bullish and red for bearish conditions.
This method works best on the H1 and H4 timeframes and suits swing traders who prefer holding trades for several hours or days.
It can be effectively used on currency pairs such as USD/JPY, EUR/CHF, and GBP/CAD, where swing structures are more pronounced.
Buy Entry Rules
- Wait until the price breaks and closes above the previous swing high on the Swing Level indicator.
- Confirm that the Super Trend Oscillator is showing blue histogram bars, signaling bullish momentum.
- Open a buy position at the next candle open after confirmation.
- Place a stop loss just below the last swing low or 10 pips below the entry point, whichever is lower.
- Set take profit at 70–100 pips or at the next resistance level.
Sell Entry Rules
- Wait until the price breaks and closes below the previous swing low on the Swing Level indicator.
- Confirm that the Super Trend Oscillator is displaying red histogram bars, showing bearish momentum.
- Enter a sell trade at the next candle open.
- Set a stop loss just above the most recent swing high or 10 pips above entry, whichever is higher.
- Take profit when the price reaches the next support area or after gaining 70–100 pips.
Advantages
- Combines breakout logic with trend confirmation for higher accuracy.
- Eliminates false entries caused by short-term retracements.
- Well-suited for medium-term swing traders.
- Works effectively on most trending currency pairs.
- Clear visual signals make decision-making easier.
Drawbacks
- It may produce fewer trades in sideways markets.
- Breakouts can sometimes fail during low-volatility sessions.
- Requires patience to wait for the candle closes beyond swing levels.
- Stop losses can be hit in choppy price environments.
Case Study 1 – USD/JPY H4 Chart
On the H4 chart of USD/JPY, the price broke above a key swing high at 153.20, confirming renewed bullish momentum.
The Super Trend Oscillator turned blue simultaneously, providing a clear buy signal.
A long entry was taken at 153.25 with a stop loss at 152.75 and a take profit target of 154.25.
Over the next two trading sessions, the pair climbed steadily to reach the target for a 100-pip gain as trend strength increased.
Case Study 2 – GBP/CAD H1 Chart
On the GBP/CAD pair, a breakdown below a previous swing low at 1.7450 coincided with red histogram bars on the Super Trend Oscillator.
A sell trade was opened at 1.7445 with a stop loss at 1.7490 and a take profit at 1.7350.
The market continued to slide throughout the London and New York sessions, achieving a 95-pip profit before showing early signs of reversal.
Strategy Tips
- Always confirm swing breakouts with the Super Trend Oscillator to filter out false moves.
- Use higher time frames (H4 or D1) for stronger swing trends and better accuracy.
- Monitor upcoming economic news to avoid entering just before major data releases.
- Trailing stops can help lock in profits during extended swings.
- Stick to one or two pairs to master their behavior and swing rhythm.
This MT4 swing trading strategy provides a structured and practical approach to catching high-probability market swings.
By aligning breakout signals from the Swing Level Indicator with the trend confirmation from the Super Trend Oscillator, traders can identify momentum-driven entries and stay on the right side of the market.
Download Now
Download the “Level_Trading.mq4” indicator for Metatrader 4
FAQ
Which timeframe is most effective for this indicator?
The Swing Level Forex Indicator performs best on H1, H4, and D1 charts.
These timeframes produce swing levels that are respected more consistently and offer cleaner price reactions.
Does the indicator repaint swing levels?
Once a swing high or swing low is confirmed, the level remains fixed.
New swing levels may appear as price develops, but previous levels do not shift.
Can this indicator be used for breakout trading?
Yes. The indicator is particularly effective for breakout strategies where trades are taken after price closes beyond a swing level, signaling renewed momentum.
Summary
The Swing Level Forex Indicator for MT4 offers a practical way to trade using swing highs and swing lows as dynamic support and resistance.
It simplifies market analysis and helps traders focus on price movement rather than lagging signals.
The indicator is easy to use and adapts well to different trading styles and timeframes.
Its effectiveness improves when it is combined with a trend-based tool in the strategy, allowing traders to filter trades and improve timing.
As the name suggests, the Swing Level Forex Indicator finds and displays key swing levels on the chart. W
hen used consistently, it can become a reliable foundation for disciplined and level-based trading decisions.


