
About the Forex Trend Display v1.02 Indicator
The Forex Trend Display v1.02 Indicator for MT4 is a dashboard signals tool that shows the longer-term trend across H1, H4, D1, W1, and MN charts.
It provides a quick overview of multiple currency pairs and highlights strong buy and sell trends.
Blue arrows indicate a strong uptrend, while red arrows indicate a strong downtrend.
Traders can quickly identify the overall market direction and align their trades with the dominant trend for higher probability setups.
This indicator works well for intraday trading and can also be used for scalping setups when combined with shorter time frame confirmation.
Free Download
Download the “Lawgirl’s Trend Display v1.02.mq4” indicator for MT4
Key Features
- Dashboard showing buy and sell trends across multiple timeframes
- Supports H1, H4, D1, W1, and MN charts
- Displays trends for multiple currency pairs simultaneously
- Blue arrows indicate an uptrend, red arrows indicate a downtrend
- Helps identify strong trend alignment for higher probability trades
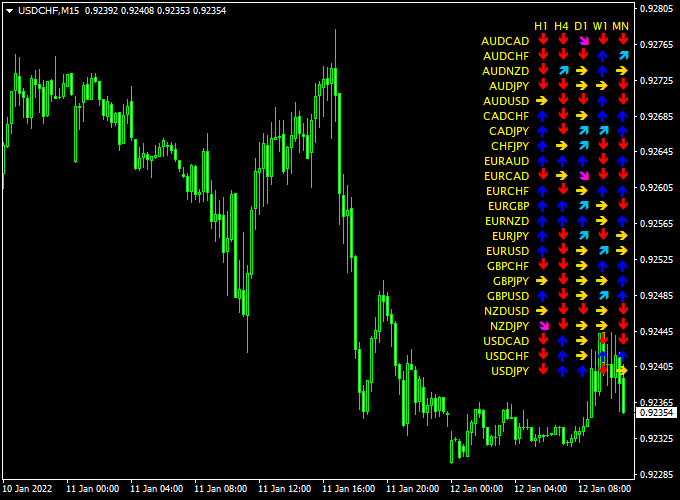
Indicator Chart
The chart shows the Forex Trend Display v1.02 Indicator on MT4.
The dashboard highlights currency pairs with blue arrows for strong uptrends and red arrows for strong downtrends.
Traders can use this information to enter trades in the direction of the dominant trend for both intraday and scalping setups.
Guide to Trade with Forex Trend Display v1.02 Indicator
Buy Rules
- Enter a buy when all dashboard arrows for a currency pair are blue (strong uptrend)
- Confirm trend direction using higher timeframe indicators or moving averages
Sell Rules
- Enter a sell when all dashboard arrows for a currency pair are red (strong downtrend)
- Confirm trend direction using higher timeframe indicators or moving averages
Stop Loss
- For buys, place stops below the recent swing low or support zone
- For sells, place stops above the recent swing high or resistance zone
- For scalping on M1–M5, use tighter stops based on smaller timeframe price swings
Take Profit
- For intraday trades, target the next major support/resistance levels
- For M1–M5 scalping, aim for 5–20 pips depending on price action
- Exit fully if arrows start showing mixed colors, indicating trend weakening
Practical Tips
- Use M15–H1 charts for intraday trades and M1–M5 for quick scalping confirmations
- Focus on trades where all arrows align for higher probability setups
MT4 Multi-Timeframe Day Trading Strategy Using Forex Trend Display and AMA Signals
This MT4 strategy combines the Forex Trend Display V1.02 Indicator MT4 and the AMA Signals Metatrader 4 Forex Indicator to identify high-probability trades across multiple timeframes.
The Forex Trend Display provides longer-term trend direction with blue arrows for buy trends and red arrows for sell trends in a dashboard format.
The AMA Signals indicator provides precise buy and sell entries with blue dots for buys and brown dots for sells.
This strategy works on M5, M15, M30, and H1 charts, making it suitable for both short-term and intraday trading.
Buy Entry Rules
- Check the Forex Trend Display dashboard: ensure the trend arrow for your trading timeframe is blue, indicating a bullish trend.
- Wait for the AMA Signals indicator to show a blue dot on the same timeframe.
- Enter a buy trade at the close of the confirming candle.
- Set the stop loss below the most recent swing low.
- Close the trade when a brown AMA dot appears or the Forex Trend Display arrow changes to red, signaling a potential trend reversal.
Sell Entry Rules
- Check the Forex Trend Display dashboard: ensure the trend arrow for your trading timeframe is red, indicating a bearish trend.
- Wait for the AMA Signals indicator to show a brown dot on the same timeframe.
- Enter a sell trade at the close of the confirming candle.
- Set the stop loss above the most recent swing high.
- Close the trade when a blue AMA dot appears or the Forex Trend Display arrow changes to blue, signaling a potential trend reversal.
Advantages
- Combines longer-term trend confirmation with precise entry signals.
- Works across multiple timeframes (M5, M15, M30, H1) for flexible trading styles.
- Dashboard view allows a quick assessment of overall market trends.
- Clear exit signals help lock in profits and reduce losses.
Drawbacks
- Signals can lag during rapid trend changes, causing delayed entries or missed opportunities.
- AMA dots may produce occasional false signals in low volatility or consolidating markets.
Case Study 1 – EUR/USD M15
On the EUR/USD M15 chart, the Forex Trend Display arrow was blue across for your chosen timeframe, indicating a strong bullish trend.
The AMA Signals indicator displayed a blue dot, prompting a buy entry at 1.1080 with a stop loss at 1.1065.
The trade was closed when a brown AMA dot appeared at 1.1110, resulting in a 30-pip profit.
Case Study 2 – GBP/JPY H1
On the GBP/JPY H1 chart, the Forex Trend Display arrow was red, indicating a bearish trend.
A brown AMA dot appeared, signaling a sell entry at 149.50 with a stop loss at 149.80.
The trade closed when a blue dot appeared at 148.95, resulting in a 55-pip gain.
Using both trend direction and entry confirmation helped capture a strong intraday move.
Strategy Tips
- Focus on higher volatility sessions like London and New York for larger intraday moves.
- Always confirm trend direction on at least two higher timeframes before entering trades.
- Use proper risk management with tight stop losses relative to the timeframe.
- Consider partial profit-taking on longer timeframes while letting part of the position run.
- Keep an eye on major news events that could override indicator signals.
Download Now
Download the “Lawgirl’s Trend Display v1.02.mq4” indicator for Metatrader 4
FAQ
Can this indicator be used for M1–M5 scalping?
Yes. While the dashboard shows longer-term trends, you can combine it with short-term M1–M5 charts for scalping confirmation.
How do I confirm the trend before entering?
Use moving averages, trendlines, or other indicators on smaller time frames to confirm the trend aligns with the dashboard signals.
When is the best time to trade with this indicator?
The London and New York sessions provide the best conditions due to high liquidity and strong trending moves.
Summary
The Forex Trend Display v1.02 Indicator for MT4 shows strong trend alignment for multiple currency pairs across H1, H4, D1, W1, and MN charts.
Traders can use this dashboard to align intraday or scalping trades with dominant trends.
Stop loss and take profit can be set based on swing points, support/resistance, or smaller timeframe confirmations.
Combining this indicator with trend or momentum tools improves accuracy, reduces false signals, and helps traders capture high-probability setups efficiently across different trading styles.


