
About the Graf Analysis Indicator
The Graf Analysis indicator for MT4 is a trend-based trading tool that plots a dynamic channel directly on the main chart.
It follows the Graf analysis trading method to help traders identify high-probability buy and sell zones.
The upper and lower channel bands act as resistance and support levels.
Traders can enter long positions near the lower band in an uptrend and short positions near the upper band in a downtrend.
This indicator is useful for scalping, day trading, and swing trading.
Free Download
Download the “graf-analysis.mq4” indicator for MT4
Key Features
- Plots a trend channel on the main MT4 chart
- Upper and lower red bands act as resistance and support
- Signals trades based on channel touch points
- Shows trend direction for clearer decision-making
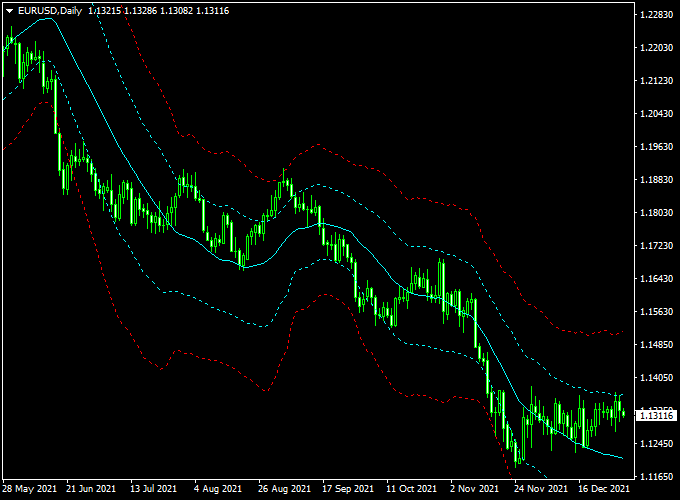
Indicator Chart
The chart shows the Graf Analysis channel applied to an MT4 chart.
Price touching the lower band signals a potential buy in an uptrend.
Price touching the upper band signals a potential sell in a downtrend.
The channel helps traders time entries and exits with higher confidence.
Guide to Trade with Graf Analysis Indicator
Buy Rules
- Enter a buy trade when price touches the lower red band
- Confirm that the channel is sloping upwards
- Close or reverse if the channel starts trending down
Sell Rules
- Enter a sell trade when price touches the upper red band
- Confirm that the channel is sloping downwards
- Close or reverse if the channel starts trending up
Stop Loss
- For buy trades, place a stop loss slightly below the lower channel band
- For sell trades, place a stop slightly above the upper channel band
- Adjust based on volatility and timeframe
Take Profit
- Close trades near the opposite channel band
- Take partial profits at key support or resistance levels
- Use trailing stops if the trend continues strongly
Practical Tips
- Enter trades only when price respects the channel bands
- Trade in the direction of the channel slope
- Check higher timeframes to confirm the overall trend
- Use oscillators to spot overbought or oversold areas
- Avoid trades when price moves sideways along the channel
- Take partial profits near key support or resistance levels
Graf Analysis + Pips Hunter Intraday Strategy for MT4
This MT4 intraday strategy combines the Graf Analysis Forex Indicator with the Pips Hunter Indicator.
The Graf Analysis indicator shows an upward-sloping channel for bullish trends and a downward-sloping channel for bearish trends.
The Pips Hunter Indicator generates blue arrows for buy signals and red arrows for sell signals.
Using both indicators together provides precise intraday entry points aligned with the market trend.
This strategy works best on 5-minute to 15-minute charts and is suitable for currency pairs such as EUR/USD, GBP/USD, and USD/JPY.
Why this combo works
The Graf Analysis indicator identifies the prevailing trend, while the Pips Hunter indicator pinpoints entry signals.
Aligning both reduces false entries and increases the probability of profitable trades during intraday sessions.
Buy Entry Rules
- Graf Analysis shows an upward-sloping channel (bullish trend).
- Pips Hunter Indicator displays a blue arrow.
- Enter at the close of the candle where the blue arrow appears.
- Stop loss: 5–10 pips below the recent swing low.
- Take profit: 10–20 pips depending on pair volatility and timeframe.
Sell Entry Rules
- Graf Analysis shows a downward sloping channel (bearish trend).
- Pips Hunter Indicator displays a red arrow.
- Enter at the close of the candle where the red arrow appears.
- Stop loss: 5–10 pips above the recent swing high.
- Take profit: 10–20 pips depending on pair volatility and timeframe.
Advantages
- Clear entry signals combining trend analysis with precise arrows.
- Suitable for intraday scalping and short-term trades.
- Can be applied to various currency pairs and timeframes.
Drawbacks
- May produce false signals in choppy or low volatility markets.
- Requires active monitoring due to fast intraday movements.
- Performance depends on quick execution and low spreads.
Example Case Study 1 — EUR/USD, 5-Minute
Timeframe: 5M. Pair: EUR/USD. Session: London open.
Graf Analysis shows upward upward-sloping channel, and Pips Hunter displays a blue arrow.
Entry: 1.1005. Stop loss: 1.0995 (10 pips). Take profit: 1.1020 (15 pips).
Trade closed successfully.
Example Case Study 2 — GBP/USD, 15-Minute
Timeframe: 15M. Pair: GBP/USD. Session: New York overlap.
Graf Analysis shows a downward-sloping channel, and Pips Hunter displays a red arrow.
Entry: 1.2715. Stop loss: 1.2725 (10 pips). Take profit: 1.2700 (15 pips).
Trade closed at the target.
Strategy Tips
- Trade during active sessions for higher liquidity.
- Combine with other indicators or price action for confirmation.
- Always use proper risk management, including stop losses and appropriate lot sizes.
- Backtest on different pairs and sessions to optimize settings.
Download Now
Download the “graf-analysis.mq4” indicator for Metatrader 4
FAQ
Can I use Graf Analysis on any currency pair?
Yes. It works on all pairs but performs best on trending pairs with clear support and resistance levels.
Which timeframe is ideal?
It works on all timeframes. Scalpers can use lower charts, while H1–H4 are best for day and swing trading.
Does the indicator repaint?
No. Once the channel is plotted, it remains fixed for reliable live trading and backtesting.
Can I combine it with other indicators?
Yes. Moving averages, RSI, or support/resistance levels can help confirm entries and exits.
Summary
The Graf Analysis indicator for MT4 provides a trend channel that helps traders identify high-probability buy and sell zones.
The upper and lower channel bands act as dynamic resistance and support levels, guiding entry and exit points.
Combining the channel with trend-following or momentum indicators improves accuracy and confidence.
It is suitable for scalping, day trading, and swing trading across all currency pairs, making it a versatile tool for Forex traders.


