About the Advanced Bollinger Bands Indicator
The Advanced Bollinger Bands Indicator for MT4 is an upgraded version of the classic volatility tool designed to identify trend direction and exhaustion points.
Unlike standard bands, this version uses color-coded zones to highlight optimal entry and exit areas.
The indicator curves upward during bullish trends and downward during bearish phases, providing an immediate snapshot of market sentiment.
Its essential function is to map out price boundaries, helping traders buy at undervalued levels in uptrends and sell at overvalued levels in downtrends.
Free Download
Download the “advanced-bollinger-bands.ex4” MT4 indicator
Key Features
- The indicator features color-coded red and green zones to simplify entry and exit decisions.
- It dynamically adjusts to market volatility, expanding during high activity and contracting during consolidation.
- The tool works efficiently across all timeframes, from M1 for scalping to D1 for position trading.
- It provides a clear directional bias based on the slope of the bands.
- The settings are fully customizable to suit different currency pairs and trading styles.
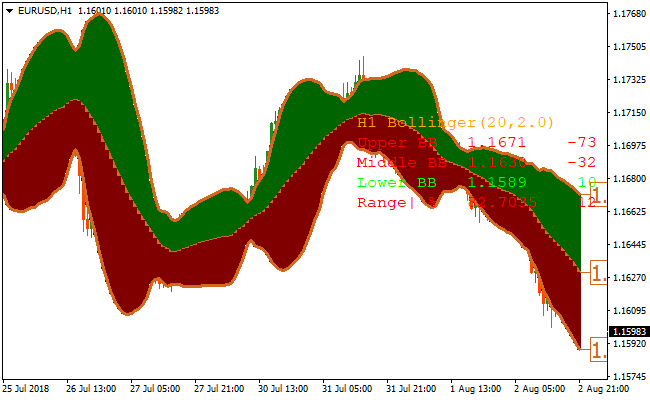
Indicator Chart
The chart displays the Advanced Bollinger Bands Indicator enveloping price action.
You can see the bands pointing upward during a rally, with the red area acting as a support zone for entries.
The green area marks the upper boundary where price momentum typically slows down, signaling potential profit-taking levels.

Guide to Trade with the Advanced Bollinger Bands Indicator
Buy Rules
- Confirm that the bands are sloping upward to signal an established uptrend.
- Wait for the price to pull back into the red area of the indicator.
- Open a buy order once price action shows signs of rejection within this lower zone.
Sell Rules
- Confirm that the bands are sloping downward to signal an established downtrend.
- Wait for the price to rally into the green area of the indicator.
- Open a sell order once price action shows signs of rejection within this upper zone.
Stop Loss
- For buy trades, place the stop loss outside the lower red band.
- For sell trades, place the stop loss outside the upper green band.
Take Profit
- Exit buy trades when the price reaches the green area of the bands.
- Exit sell trades when the price reaches the red area of the bands.
- Alternatively, use a trailing stop to capture extended moves if the bands continue to slope sharply.
Advanced Bollinger Bands and RSI Triple Stochastic Divergence Forex Scalping Strategy
This MT4 scalping strategy combines trend and volatility from the Advanced Bollinger Bands Metatrader 4 Forex Indicator with the momentum divergence signals from the RSI Triple Stochastic Divergence Indicator MT4.
The Advanced Bollinger Bands help identify trend direction by measuring whether the bands are rising (bullish) or falling (bearish).
The RSI Triple Stochastic Divergence indicator uses a histogram above zero for bullish divergence and below zero for bearish divergence, helping confirm entry timing.
This strategy is designed for scalping on short timeframes such as M5 and M15 where quick, small moves are more common.
By combining volatility trend with momentum divergence, you focus on trades that respect both underlying price structure and near-term signal strength.
It is suitable for traders who want clear rules and reduced noise in entry decisions.
Buy Entry Rules
- The Advanced Bollinger Bands are rising, indicating a bullish trend and volatility expansion to the upside.
- The RSI Triple Stochastic Divergence blue histogram is above zero, signaling bullish divergence momentum.
- Enter a buy trade at the close of the candle where the histogram first moves above zero while the bands are rising.
- Place the stop loss a few pips below the recent swing low or below the lower Bollinger Band.
- Exit the trade when the histogram turns below zero or the bands begin to flatten or turn downward, indicating weakening momentum.
Sell Entry Rules
- The Advanced Bollinger Bands are falling, indicating a bearish trend and volatility expansion to the downside.
- The RSI Triple Stochastic Divergence red histogram is below zero, signaling bearish divergence momentum.
- Enter a sell trade at the close of the candle where the histogram first moves below zero while the bands are falling.
- Place the stop loss a few pips above the recent swing high or above the upper Bollinger Band.
- Exit the trade when the histogram turns above zero or the bands begin to flatten or turn upward, indicating weakening momentum.
Advantages
- Combines trend and momentum divergence for higher quality scalping signals.
- Clear rising and falling band structure helps define market direction and volatility expansion.
- The divergence histogram adds early momentum confirmation before price runs out of steam.
- Effective on multiple short timeframes such as M5 and M15.
- Simple rules help reduce hesitation and increase consistency.
Drawbacks
- Divergence signals can occasionally lag price action in fast reversals.
- Requires discipline to exit when momentum weakens rather than holding for larger moves.
- Spread and slippage can reduce net scalping profits, especially on pairs with higher costs.
Case Study 1 – EURUSD M5
On EURUSD in an M5 timeframe, the Advanced Bollinger Bands began rising after a brief pullback, signaling renewed bullish pressure.
Shortly after, the RSI Triple Stochastic Divergence histogram moved above zero.
A buy trade was entered at the close of that candle with the stop loss placed just below the lower band and recent swing low.
Price continued higher over the next several bars, and the histogram stayed above zero until the bands started flattening.
The trade was closed as momentum weakened, capturing 14 pips in profit in a tight scalping move.
Case Study 2 – GBPUSD M15
On GBPUSD using the M15 timeframe, the Advanced Bollinger Bands were trending downward, indicating bearish pressure.
The RSI Triple Stochastic Divergence histogram then dropped below zero.
A sell trade was entered at the close of the signal candle with the stop loss placed just above the upper band and recent swing high.
Price continued lower and the histogram remained below zero for multiple bars before turning upward.
The trade was exited as the histogram turned above zero, capturing 36 pips as the market began to shift.
Strategy Tips
- Wait for clear band direction before entering; avoid trades when the bands are flat or crossing frequently.
- Confirm that momentum divergence aligns with band direction to increase the probability of a successful scalp.
- Use tighter stop losses in low volatility conditions and wider ones during high volatility to reduce premature stop outs.
- Avoid entering just as major news events release, as price spikes can trigger stops even in strong trends.
- Focus on high liquidity hours like the London and New York overlap for better trend continuation after entry.
- Practice discipline in exiting trades when the histogram turns against you, rather than waiting for a larger move confirmation.
Download Now
Download the “advanced-bollinger-bands.ex4” Metatrader 4 indicator
FAQ
What is the main difference between this and the standard version?
The Advanced Bollinger Bands Indicator uses specific color zones to indicate where to buy and sell within a trend.
This removes the ambiguity of standard bands by clearly defining the red area for buying in uptrends and the green area for selling in downtrends.
How do I handle the bands when they are moving sideways?
When the bands are flat, the market is ranging. In this scenario, you can trade the reversals between the red and green areas.
However, the highest probability trades occur when the bands are clearly sloping in one direction.
Can I modify the standard deviation and period?
Yes, the indicator is fully customizable.
Increasing the period will smooth out the bands for long-term trading, while decreasing it makes the indicator more responsive to recent price changes for intraday execution.
Summary
The Advanced Bollinger Bands Indicator is a powerful tool for traders who want to capitalize on market volatility and trend retracements.
Its primary benefit is the visual clarity provided by its color-coded zones, which helps traders avoid chasing price and instead wait for high-probability pullbacks.
Whether you are a scalper or a swing trader, this indicator offers a disciplined framework for identifying value areas in any market condition.
Integrating it into your workflow allows for more precise entries and a clearer understanding of when a trend is losing its momentum.


