
The William %R Histogram Indicator for MetaTrader 4 is a momentum oscillator that displays trend direction through colored histogram bars.
Green bars indicate bullish momentum, while red bars signal bearish momentum.
This indicator provides visual alerts, making it suitable for traders seeking to identify potential entry and exit points based on the Williams %R technical analysis tool.
Key Points
- Based on the %R technical indicator
- Provides buy & sell signals with alerts
- Beginner friendly
- Well worth adding to your indicator collection
This indicator can work together with any existing trading strategy or system as a simple trend confirmation tool.
Free Download
Download the “William histogramm with alert.mq4” MT4 indicator
Trading Chart
The EUR/USD 1-hour chart below shows the William %R Histogram indicator in action.
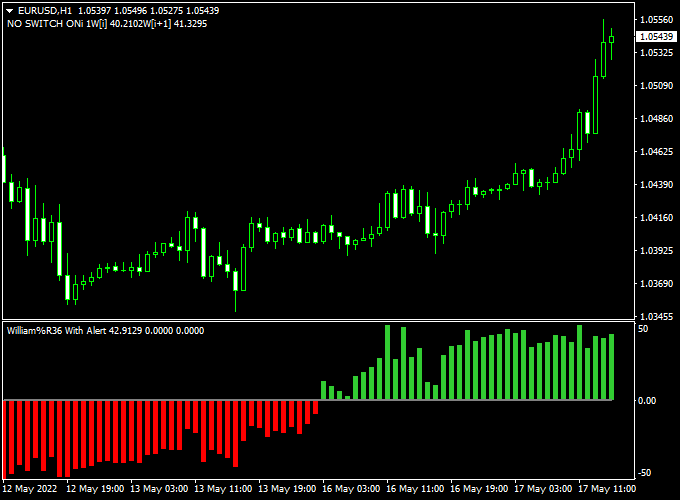
Basic Trading Signals From the William %R Histogram Indicator
BUY:
- Open a buy position as soon as the first green colored William %R Histogram bar appears on the chart.
- Place a stop loss below the previous swing low price.
- Exit the buy trade for a predetermined profit target or wait for a sell signal.
SELL:
- Open a sell position as soon as the first red colored William %R Histogram bar appears on the chart.
- Place a stop loss above the previous swing high price.
- Exit the sell trade for a predetermined profit target or wait for a buy signal.
Download Now
Download the “William histogramm with alert.mq4” MT4 indicator
MT4 Trading Strategy: William %R Histogram + Market Sentiment Indicator
This strategy is built on detecting price reversals using the William %R Histogram Indicator with Alert, confirmed by the directional signals from the Market Sentiment Forex Signal Indicator.
It’s a powerful setup for counter-trend or mean-reversion trading with confirmation.
Recommended Timeframes
- M15, M30, or H1 — suitable for intraday and short-term swing trades
Indicators Used
Buy Trade Setup
- Wait for the William %R Histogram to drop below the -80 level, entering oversold territory, and show a bullish histogram color or alert.
- Confirm that the Market Sentiment Indicator shows a buy signal (typically a green arrow or sentiment value above 50%).
- Enter a buy trade on the next candle close after both conditions are met.
- Place your stop loss just below the recent swing low or support zone.
- Set your take profit at a 1:2 or 1:3 risk-to-reward ratio, or at the next resistance level.
Sell Trade Setup
- Wait for the William %R Histogram to rise above the -20 level, entering overbought territory, and show a bearish histogram color or alert.
- Confirm that the Market Sentiment Indicator displays a sell signal (typically a red arrow or sentiment below 50%).
- Enter a sell trade on the next candle close after confirmation.
- Place your stop loss just above the recent swing high or resistance area.
- Set your take profit at a 1:2 or 1:3 risk-to-reward ratio, or at the next support level.
Strategy Tips
- Use this strategy during high volatility sessions (London and New York) for stronger reversals.
- Avoid using during consolidation or flat market conditions.
- Look for divergences between price and the %R histogram to anticipate early reversal setups.
Strategy Conclusion
This Forex strategy offers high-probability trade setups with clear, rule-based entries.
It’s especially useful for traders looking to catch turning points before major trends begin.
Adjustable Indicator Parameters & Settings
Colors, style
Technical Information
Currency Pairs: works on any currency pair
Trading Platform: developed for Metatrader 4 (MT4)
Time Frames: any
Indicator Type: oscillator
Frequently Asked Questions
Is the William %R Histogram Indicator suitable for beginners?
Yes, the indicator is beginner-friendly due to its simple visual signals. However, beginners should practice on a demo account first to become familiar with interpreting the signals accurately and to develop a solid understanding of trend-following techniques.
Can the William %R Histogram Indicator be used on all currency pairs?
Yes, the indicator works on all major and minor currency pairs in MetaTrader 4. It’s particularly effective on volatile pairs like EUR/USD, GBP/JPY, and XAU/USD. Testing it on your preferred pairs and timeframes is recommended to optimize performance.
Does the William %R Histogram Indicator repaint?
No, the William %R Histogram Indicator does not repaint. It provides reliable signals based on historical data, ensuring that the information it displays remains consistent and accurate over time.
Can I customize the appearance of the William %R Histogram Indicator?
Yes, the appearance of the William %R Histogram Indicator can be customized. You can adjust the colors, line styles, and other visual settings through the indicator’s properties in MetaTrader 4 to suit your preferences.
Final Thoughts
The William %R Histogram Indicator is a valuable tool for traders seeking to identify short-term market trends.
Its non-repainting nature ensures reliability, while the clear visual signals aid in making informed trading decisions.
Ideal for both beginners and experienced traders, it can be seamlessly integrated into various trading strategies.


