As the name suggests, the Yearly Pivot Point indicator for MT4 shows the yearly pivot point with accompanying support & resistance levels on the chart.
Every day, the indicator automatically updates the pivot point and S & R levels.
In essence, the Yearly Pivot Point indicator reveals the long-term currency trend and should be useful for both swing traders and investors.
Key Points
- Displays the yearly pivot point & support/resistance levels
- Dynamically updates all levels every trading day
- Reveals the major currency trend
- Good for swing traders and investors
- Well worth adding to your indicator collection
This indicator can work together with any existing trading strategy or system as a trend bias technical tool.
Free Download
Download the “YearlyPivot.mq4” MT4 indicator
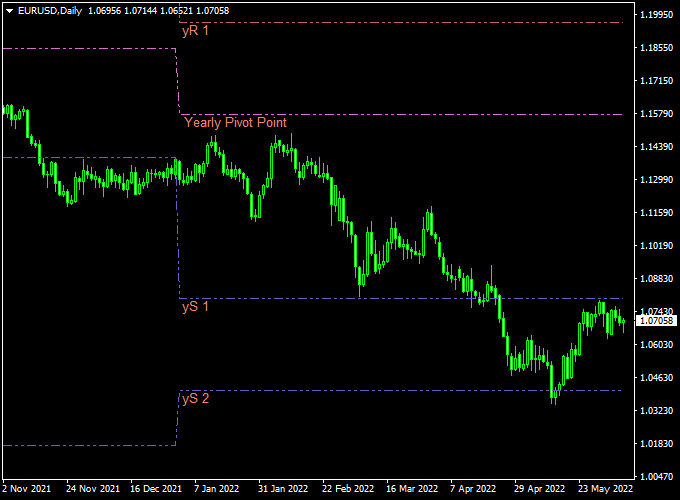
Indicator Example Chart
The EUR/USD daily chart below shows the Yearly Pivot Point Forex indicator in action.

Basic Trading Signals
Signals from the Yearly Pivot Point indicator are easy to interpret and go as follows:
BUY:
- Open a long-term buy trade when the price closes above the yearly pivot point (bullish).
- Place a stop loss below the previous swing low level.
- Take profit at a risk-to-reward ratio of at least 1.5 or better.
SELL:
- Open a long-term sell trade when the price closes below the yearly pivot point (bearish).
- Place a stop loss above the previous swing high level.
- Take profit at a risk-to-reward ratio of at least 1.5 or better.
Download Now
Download the “YearlyPivot.mq4” MT4 indicator
Yearly Pivot Point with 50 & 200 EMA Metatrader 4 Strategy
Overview
This strategy integrates the Yearly Pivot Point Forex Indicator with the 50 and 200 EMAs to identify potential entry and exit points in the forex market.
It’s designed for traders who prefer medium to long-term trading techniques.
Indicators Used
- Yearly Pivot Point Forex Indicator – Displays yearly pivot points along with support and resistance levels to identify key price levels.
- 50 EMA – A medium-term exponential moving average to gauge intermediate trend direction.
- 200 EMA – A long-term exponential moving average to determine the overall market trend.
Timeframes and Pairs
- Timeframes: H4 (4-hour) and D1 (Daily)
- Currency Pairs: Major pairs (e.g., EUR/USD, GBP/USD)
Buy Entry Conditions
- Price is above both the 50 EMA and 200 EMA, indicating an uptrend.
- The 50 EMA is above the 200 EMA, confirming bullish momentum.
- Price retraces to the Yearly Pivot Point or a significant support level near the 50 EMA.
- A bullish candlestick pattern forms at the retracement level.
Sell Entry Conditions
- The price is below both the 50 EMA and 200 EMA, indicating a downtrend.
- The 50 EMA is below the 200 EMA, confirming bearish momentum.
- Price retraces to the Yearly Pivot Point or a significant resistance level near the 50 EMA.
- A bearish candlestick pattern forms at the retracement level.
Exit Strategy
- Stop Loss: Place below the recent swing low for buy trades or above the recent swing high for sell trades.
- Take Profit: Aim for a risk-to-reward ratio of at least 1:2, targeting the next significant support or resistance level.
Additional Trading Tips
- Ensure that the trade direction aligns with the overall market trend indicated by the 200 EMA.
- Use the Yearly Pivot Point levels to identify key areas where price may reverse or continue.
- Backtest the strategy on historical data to assess its performance before live trading.
Configurable Parameters & Settings
Colors, style
Technical Information
Currency Pairs: works on any currency pair
Trading Platform: developed for Metatrader 4 (MT4)
Time Frames: works on any time frame (preferred H4 and higher)
Indicator Type: pivot point
Final Thoughts
The Yearly Pivot Point Forex Indicator for MT4 is a valuable tool for traders seeking to identify long-term market trends and key support/resistance levels.
By displaying the yearly pivot point along with its associated support and resistance levels on the chart, it provides a clear framework for analyzing price movements over an extended period.
The indicator automatically updates these levels daily, ensuring that traders have the most current information at their disposal.
This feature is particularly beneficial for swing traders and investors who focus on medium to long-term strategies.
By aligning trades with the prevailing market trend indicated by the yearly pivot point, traders can enhance their decision-making process and potentially improve their trading outcomes.


