About the Absolute Strength Averages Indicator
The Absolute Strength Averages indicator for MT5 measures absolute trend strength and generates actionable buy and sell signals.
By analyzing the relationship between the green and orange lines, traders can identify potential trend shifts with higher confidence.
The indicator includes smoothing filters to reduce market noise and enhance signal accuracy, helping traders anticipate future price moves.
This tool works best in trending markets and is less effective in sideways conditions.
It allows traders to evaluate momentum quickly, identify trade opportunities, and align trades with the prevailing trend.
Adjustable settings, such as calculation method, calculation length, smoothing, signal smoothing, price type, and averaging method, let traders tailor the indicator to their preferred strategy.
Free Download
absolute_strength_-_averages.mq5 Indicator (MT5)
Key Features
- Measures absolute trend strength using dual lines for precise signals.
- Generates buy signals when the green line crosses above the orange line.
- Generates sell signals when the orange line crosses above the green line.
- Smoothing filters enhance accuracy and reduce false signals.
- Customizable inputs for calculation method, length, smoothing, and averaging.
Indicator Chart
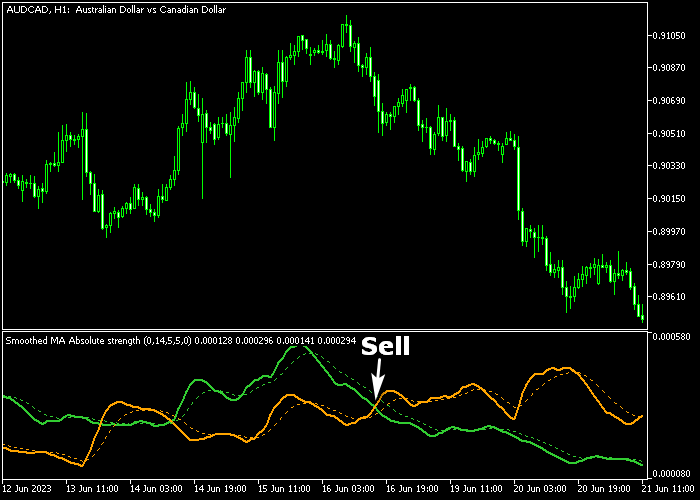
The Absolute Strength Averages indicator displays green and orange lines on the main chart.
When the green line crosses above the orange line, it signals bullish momentum, while a cross of the orange above the green line signals bearish momentum.
The chart helps traders quickly identify potential entry points and evaluate the current trend strength.
Guide to Trade with Absolute Strength Averages Indicator
Buy Rules
- Open a buy trade when the green line crosses above the orange line from below.
- Ensure the cross occurs while the trend is showing upward momentum.
- Confirm recent candlestick action supports the bullish move.
- Consider the first green line cross after a period of downward movement as a stronger entry.
Sell Rules
- Open a sell trade when the orange line crosses above the green line from above.
- Ensure the cross occurs while the trend is showing downward momentum.
- Confirm recent candlestick action supports the bearish move.
- Consider the first orange line cross after a period of upward movement as a stronger entry.
Stop Loss
- Place the stop loss below the most recent support low for buy entries.
- Set the stop loss above the most recent resistance high for sell entries.
- Move stop to break-even once the trade shows consistent profit.
Take Profit
- Close the trade when the opposite line cross appears on the chart.
- Alternatively, target a profit level you prefer for the trade.
- Use a trailing stop to lock in gains while letting the trend continue.
Absolute Strength Averages Scalping Strategy with RSI Filter Indicator for MT5
This scalping strategy combines the Absolute Strength Averages Indicator and the RSI Filter Indicator to capture short bursts of momentum with strong confirmation.
It is designed for fast-paced trading where timing and clarity matter most.
The Absolute Strength Averages indicator measures the balance between buyers and sellers by comparing bullish and bearish pressure.
The RSI Filter adds an extra layer of confirmation using histogram signals.
A green bar confirms bullish momentum, while a magenta bar signals bearish conditions.
This helps filter weak entries and improves trade timing.
This setup works best on M1 and M5 timeframes during high activity periods such as the London and New York sessions.
Buy Entry Rules
- Wait for the green line to cross above the orange line on the Absolute Strength Averages.
- Confirm that the RSI Filter prints a green histogram bar.
- Ensure the crossover happens with visible momentum, not in a flat market.
- Enter a buy trade at the opening of the next candle.
- Place stop loss below the most recent short-term low.
- Take profit when the RSI histogram turns magenta or when the strength lines begin to converge.
Sell Entry Rules
- Wait for the green line to cross below the orange line on the Absolute Strength Averages.
- Confirm that the RSI Filter prints a magenta histogram bar.
- Ensure the move shows clear downward pressure and not sideways movement.
- Enter a sell trade at the opening of the next candle.
- Place stop loss above the most recent short-term high.
- Take profit when the RSI histogram turns green or when the strength lines start losing separation.
Case Study 1: Gold Scalping Momentum
On XAUUSD M5 during the London session, price showed strong upward momentum after a brief consolidation.
The green line crossed above the orange line, indicating buyers were gaining control.
At the same time, the RSI Filter printed a green histogram bar, confirming bullish pressure.
A buy trade was entered immediately after the signal candle closed. The stop loss was placed below a recent pullback.
Price moved sharply upward within a few candles, offering a quick scalping opportunity.
The trade was closed when the histogram turned magenta, signaling weakening momentum.
Case Study 2: Quick Forex Reversal
On AUDJPY M1 during the New York session, price showed signs of exhaustion after a short rally.
The green line crossed below the orange line, indicating a shift toward seller dominance.
At the same time, the RSI Filter printed a magenta bar, confirming bearish momentum.
A sell trade was entered at the next candle. The stop loss was placed above the recent high.
Price dropped quickly as sellers took control.
The position was closed when the RSI histogram flipped back to green, capturing a fast intraday move.
Download Now
absolute_strength_-_averages.mq5 Indicator (MT5)
FAQ
Which market conditions are ideal for this indicator?
It performs best in trending markets. Signals in sideways or range-bound conditions may produce false entries, so trend confirmation is recommended.
Can I customize the indicator settings?
Yes, inputs such as calculation method (RSI), calculation length, smoothing, signal smoothing, price type, and averaging method can be adjusted to fit different strategies.
Is this indicator suitable for all timeframes?
Yes, it works on multiple timeframes. Short-term charts are useful for intraday trading, while higher timeframes provide stronger trend signals for swing trading.
Summary
The Absolute Strength Averages indicator for MT5 is a reliable tool for identifying trend strength and generating actionable buy and sell signals.
Its dual-line system highlights bullish and bearish momentum, while smoothing filters enhance accuracy.
It helps traders of all levels align trades with the prevailing trend, improve timing, and capture higher-probability opportunities.
This trading tool can complement other strategies and technical tools to strengthen trade decisions.