About the ADMI Trading Signals Indicator
The ADMI Trading Signals Indicator is a comprehensive trend-following system for Metatrader 4 that simplifies technical analysis by providing direct visual trading on the activity chart.
This tool is built upon the robust logic of the Average Directional Movement Index (ADMI), which combines the trend-measuring capabilities of the ADX with the smoothing power of moving averages.
By monitoring both trend strength and directional momentum, the indicator filters out market noise and prints green and red arrows to highlight potential entry points.
The primary benefit of the ADMI Trading Signals Indicator is its ability to alert traders to the birth of a new trend or a significant momentum shift as it happens.
While the underlying ADX calculations focus on whether a trend is strong enough to trade, the integrated moving average component ensures the arrows align with the current price flow.
Free Download
Download the “admi-trading-signals.mq4” MT4 indicator
Key Features
- It combines ADX trend strength logic with moving average smoothing for signal accuracy.
- All period and smoothing settings are fully customizable in the indicator’s inputs tab.
- The arrows appear in real-time on the main chart, reducing the need for sub-window analysis.
Indicator Chart
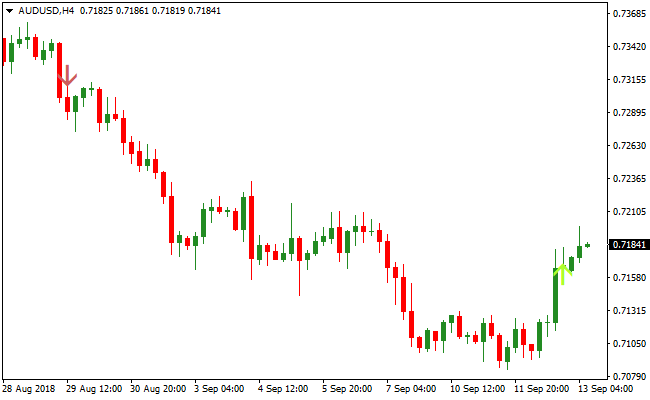
The chart displays the ADMI Trading Signals Indicator directly on the price candles.
You will notice green arrows pointing upward beneath the price action and red arrows pointing downward above it.
These arrows act as definitive triggers, indicating that the mathematical conditions for a trend shift have been met.

Guide to Trade with ADMI Trading Signals Indicator
Buy Rules
- Monitor the activity chart for the appearance of a green arrow below a price candle.
- Open a buy trade position at the opening of the next candle following the green arrow.
- Confirm that the signal occurs during an active trading session with sufficient volume.
- For higher accuracy, ensure the green arrow aligns with a bounce from a major support level.
Sell Rules
- Monitor the activity chart for the appearance of a red arrow above a price candle.
- Initiate a sell trade position at the opening of the next candle following the red arrow.
- Verify that the bearish momentum is supported by the overall market trend on a higher timeframe.
- Open the trade when the red arrow is confirmed at the close of the signaling candle.
Stop Loss
- Place the stop loss 2–3 pips beyond the most recent swing low for buy trades.
- Position the stop loss 2–3 pips beyond the most recent swing high for sell trades.
- Utilize the Average True Range (ATR) to set a volatility-based stop at 2x ATR.
- Risk no more than 1% to 2% of your total account balance on a single arrow signal.
Take Profit
- Set your target just before the next major daily support or resistance zone.
- Use a fixed risk-to-reward ratio of 1:2 to ensure long-term profitability.
- Exit the position immediately if an arrow of the opposite color appears on the chart.
- Close 50% of the position at the first target and let the rest run with a trailing stop.
MT4 Trend and Signal Strategy Using ADMI Trading Signals and Zero Lag Moving Average
This MT4 strategy combines the directional clarity of the ADMI Trading Signals Indicator with the trend-filtering power of the Zero Lag Moving Average Indicator.
Both indicators work well together because one provides the main trend direction, while the other gives precise buy and sell signals with green and red arrows.
The Zero Lag Moving Average (ZLMA) reacts faster than traditional moving averages.
When price stays above it, the market is in a bullish phase, and when price remains below it, the trend is bearish.
The ADMI indicator then provides clear arrow signals that align with this trend.
Only trading signals that match the ZLMA trend helps avoid low-quality entries.
This strategy works well on M15, M30, H1, and H4.
It suits traders who want a clean, systematic approach without complex indicators.
The rules are simple, effective, and easy to follow for beginners and experienced traders.
Buy Entry Rules
- Price must be above the Zero Lag Moving Average.
- Wait for a green arrow from the ADMI Trading Signals indicator.
- Enter a buy trade on the candle after the signal appears.
- Place the stop loss below the Zero Lag Moving Average or below the nearest swing low.
- Take profit at the next resistance level or after 1 to 2 times your stop loss distance.
Sell Entry Rules
- Price must be below the Zero Lag Moving Average.
- Wait for a red arrow from the ADMI Trading Signals indicator.
- Enter a sell trade on the next candle after the signal.
- Place the stop loss above the Zero Lag Moving Average or above the nearest swing high.
- Take profit at the next support level or after reaching 1 to 2 times the stop loss distance.
Advantages
- Clear trend direction makes it easy to avoid countertrend trades.
- Arrow signals allow precise timing without guesswork.
- Works on all major pairs and multiple time frames.
- Good balance between trend trading and signal confirmation.
- Fewer false signals because both tools must align.
Drawbacks
- Whipsaws can appear when the market has no clear trend.
- If the Zero Lag MA is flat, signals become less reliable.
- Strong news events can break through trend filters unexpectedly.
- Not ideal for very tight ranging markets where price crosses the MA repeatedly.
Case Study 1
On AUDUSD H1, price remained above the Zero Lag Moving Average for several hours during a steady uptrend.
A green ADMI arrow appeared just after a small pullback.
A buy position was taken on the next candle.
Price continued rising for about 55 pips before reaching resistance.
The stop loss, placed below the ZLMA, was safe the entire time.
This setup worked well because the trend was clean and aligned with the signal.
Case Study 2
On NZDJPY M30, price dipped below the Zero Lag Moving Average after breaking a consolidation pattern.
Soon after, a red arrow appeared from the ADMI indicator.
A sell trade was opened at the next candle.
Momentum increased and pushed the pair lower by around 40 pips before slowing down.
This trade worked because both direction and signal matched strongly with the bearish breakout.
Strategy Tips
- Look for signals that appear shortly after price pulls back toward the Zero Lag Moving Average.
- Skip trades when the Zero Lag MA is completely flat.
- For smoother performance, trade during active market sessions like London and New York.
- Check higher time frames to confirm overall direction.
- Protect profits by adjusting the stop loss once price moves strongly in your favor.
Download Now
Download the “admi-trading-signals.mq4” Metatrader 4 indicator
FAQ
What are the main components of the ADMI Trading Signals Indicator?
The indicator is a hybrid of the Average Directional Index (ADX) and a Moving Average.
The ADX component measures trend intensity, while the moving average helps determine the direction.
Together, they generate arrows that represent a confluence of trend strength and direction.
How can I reduce false signals in a ranging market?
Like most trend indicators, ADMI can produce “whipsaw” signals when price moves sideways.
To filter these out, you can increase the period settings in the inputs menu or only take signals that align with the trend of a higher timeframe (e.g., using H1 signals to filter M5 entries).
Summary
The ADMI Trading Signals Indicator is a powerful and intuitive tool for capturing market momentum.
Its primary benefit lies in the simplified arrow-based delivery of complex ADX and moving average calculations.
By focusing on green and red arrows, traders can spend less time calculating trend strength and more time managing their trades.


