
About the Advanced ADX Indicator
The Advanced ADX Indicator for MT5 measures both the strength and direction of market trends.
It is derived from the original Average Directional Index created by J. Welles Wilder, a well-known figure in technical analysis.
Unlike the traditional ADX, which uses three separate lines, this upgraded version converts the calculation into easy-to-read histogram bars.
Green bars reflect bullish pressure, while red bars indicate bearish dominance.
This simplified format helps traders react faster without interpreting multiple lines.
The indicator includes a customizable ADX period setting, allowing traders to adjust sensitivity based on timeframe and trading style.
It can function as a standalone trend tool or work alongside price action and other indicators to confirm momentum and trend continuation.
Free Download
advanced_adx.mq5 Indicator (MT5)
Key Features
- Based on the original ADX concept developed by J. Welles Wilder.
- Displays trend direction through green and red histogram bars.
- Highlights both strength and momentum shifts in real time.
- Customizable ADX period to control responsiveness.
- Can be used alone or combined with other confirmation tools.
Indicator Chart
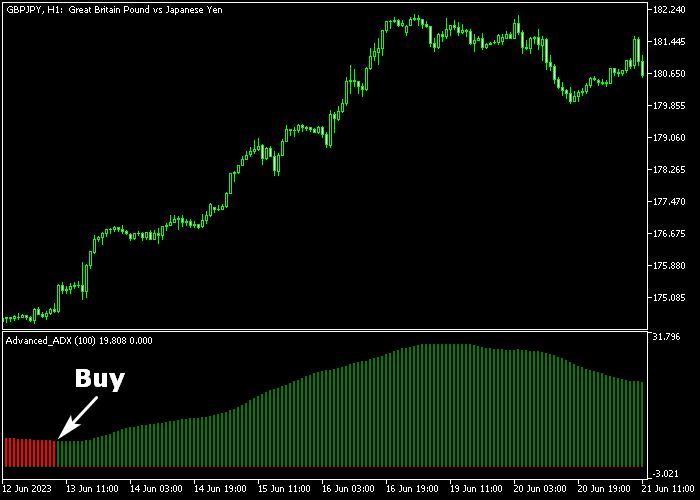
The Advanced ADX Indicator appears as a colored histogram beneath price movement.
Green bars show increasing bullish strength, while red bars signal growing bearish momentum.
The first color change often marks the start of a new directional move, offering potential entry opportunities.
Guide to Trade with Advanced ADX Indicator
Buy Rules
- Wait for the first green ADX histogram bar to appear.
- Confirm that momentum is building in the bullish direction.
- Open a buy position at the close of the green bar.
- Make sure overall market conditions support upward continuation.
Sell Rules
- Wait for the first red ADX histogram bar to appear.
- Confirm that bearish momentum is strengthening.
- Open a sell position at the close of the red bar.
- Ensure the broader trend favors downside movement.
Stop Loss
- Place the stop loss below the previous swing support for buy trades.
- Place the stop loss above the previous swing resistance for sell trades.
Take Profit
- Close buy trades when the first red ADX bar appears.
- Close sell trades when the first green ADX bar appears.
- Alternatively, set a fixed risk to reward ratio of 2.0.
- You may also trail profits while the histogram keeps the same color.
Download Now
advanced_adx.mq5 Indicator (MT5)
FAQ
What makes this version different from the classic ADX?
The traditional ADX uses three lines to show trend strength and direction.
This version converts that information into a single histogram format, making signals faster to interpret.
How does the ADX period affect performance?
A lower ADX period generates quicker signals but may react to short-term fluctuations.
A higher period smooths the readings and focuses on stronger trends.
Can the Advanced ADX Indicator be used alone?
Yes. It can serve as a standalone trend-following tool.
Many traders also combine it with support and resistance or price action for added confirmation.
Does it work on lower timeframes?
Yes. The indicator adapts to any timeframe in MT5, making it suitable for scalping, intraday trading, and swing setups.
Summary
The Advanced ADX Indicator for MT5 delivers a streamlined way to read trend strength and direction.
By transforming the traditional ADX lines into colored histogram bars, it removes unnecessary complexity and keeps the focus on momentum shifts.
Green and red bars make it easy to spot when bullish or bearish pressure starts to build.
The adjustable ADX period allows traders to fine tune sensitivity based on their preferred timeframe.
Whether used on its own or alongside other confirmation tools, the indicator provides a practical approach to identifying strong market moves and staying aligned with active trends.


