About the Band Moving Average Indicator
The Band Moving Average indicator for MT4 creates tradable bands derived from a moving average to help traders identify trend direction and key support and resistance levels.
It consists of a middle band flanked by upper and lower outer bands, forming a dynamic trading channel.
The upper blue band acts as resistance, while the lower green band functions as support.
A red intermediate band often highlights a favorable entry zone.
The slope of the bands indicates market momentum: an upward slope signals bullish pressure, and a downward slope signals bearish pressure.
Traders use this indicator for trend-following and pullback strategies.
The bands help define optimal buy and sell zones and improve timing.
Using additional confirmation tools like price action or other indicators can further enhance trade reliability.
Free Download
Download the “band-moving-average.mq4” MT4 indicator
Key Features
- Plots a middle moving average band with upper and lower tradable bands.
- Dynamic support and resistance levels adapt to price action.
- The slope of bands indicates bullish or bearish momentum.
- Highlights optimal trading zones for entries.
- Works for any trading style and timeframe.
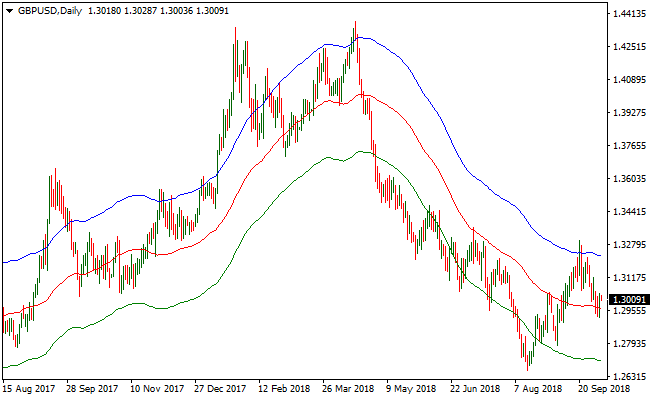
Indicator Chart
The Band Moving Average indicator chart displays a central moving average band with two outer bands.
Price interactions with the bands highlight potential buy and sell zones.
Upward-sloping bands favor long trades, while downward-sloping bands favor short trades.

Guide to Trade with Band Moving Average Indicator
Buy Rules
- Confirm the bands are sloping upward.
- Wait for the price to touch the red or green band.
- Enter a buy trade within the red-to-green band zone.
- Use additional indicators or price action to confirm the trade.
Sell Rules
- Confirm the bands are sloping downward.
- Wait for the price to touch the red or blue band.
- Enter a sell trade within the blue-to-red band zone.
- Use additional indicators or price action to confirm the trade.
Stop Loss
- For buy trades, set the stop loss below the lower green band.
- For sell trades, place the stop loss above the upper blue band.
- Adjust the stop to reflect current volatility.
Take Profit
- Close buy trades when price reaches the upper blue band.
- Close sell trades when price reaches the lower green band.
- Alternatively, exit when the band slope starts to flatten.
Band Moving Average + RSI Triple Stochastic Divergence Forex MT4 Strategy
This strategy uses the Band Moving Average MT4 indicator to determine overall market bias via band slope and the RSI Triple Stochastic Divergence MT4 indicator to time entries via its colored histogram: blue for buys, red for sells.
When the bands slope upward, the environment is bullish, and when they slope downward, the bias becomes bearish.
The divergence indicator offers a momentum signal confirming entries.
This setup is designed for M15 or H1 charts, suitable for swing or medium-term trades.
It works especially well on major and cross currency pairs that show decent volatility and clear swings.
Buy Entry Rules
- The Band Moving Average bands are sloping upward.
- The RSI Triple Stochastic Divergence indicator prints a blue histogram bar indicating a buy signal.
- Wait for price to retrace toward the moving average band or a recent swing low, then look for a bullish candle confirming support.
- Enter long after the confirmation candle closes and the histogram stays blue.
- Place a stop loss a few pips below the recent swing low or just under the lower band depending on pair volatility.
- Set take profit near a recent swing high or use a fixed reward-to-risk ratio such as 1.5 to 1 or 2 to 1.
- Alternatively, trail stop as long as the histogram remains blue and bands stay upward.
Sell Entry Rules
- The Band Moving Average bands are sloping downward.
- The RSI Triple Stochastic Divergence indicator prints a red histogram bar indicating a sell signal.
- Wait for a retracement toward the moving average band or a recent swing high, then observe for a bearish candle confirming resistance.
- Enter short after the confirmation candle closes and the histogram remains red.
- Place a stop loss a few pips above the recent swing high or just above the upper band depending on volatility.
- Take profit near a recent swing low or apply a fixed reward-to-risk ratio.
- Alternatively, trail stop while the histogram stays red and bands continue downward.
Advantages
- Combines trend direction using band slope with momentum confirmation to reduce false entries from counter-trend moves.
- Flexible and works on multiple timeframes such as M15 and H1 and across various pairs.
- Dynamic stop and target zones using moving average bands that adapt to volatility.
- Clear entry conditions make it easy to execute without over-analyzing.
Drawbacks
- In choppy or sideways markets, the band slope may flatten, leading to unclear bias.
- Retracements may not materialize, causing missed or weaker entry setups.
- Indicator signals may lag at times, and momentum can reverse before reaching the target.
- Requires patience to wait for retracement and confirmation, which may result in fewer trades.
Example Case Study 1 (EURUSD H1 bullish swing)
On EURUSD H1, during a rally the Band Moving Average bands began sloping upward.
After a strong upward move, the price retraced toward the moving average band and formed support near 1.1050.
The divergence indicator turned blue. On the next bullish candle close a buy trade was entered at 1.1053.
Stop loss was placed at 1.1025 which is 28 pips below.
Price continued upward and reached 1.1105, netting 52 pips before partial profit taking.
The band slope remained upward and the histogram stayed blue, so the trailing stop was adjusted and the final result was 60 pips.
Example Case Study 2 (USDJPY M15 bearish move)
On USDJPY M15, the bands started sloping downward after a topping move.
Price retraced upward toward the upper band at 155.80 and the divergence indicator printed a red histogram.
A bearish confirmation candle closed at 155.78, triggering a short entry.
Stop loss was set at 156.05 which is 27 pips above.
The price dropped to 155.25, a move of 53 pips before bouncing. Histogram remained red and bands stayed downward.
Trade was closed at 155.25, capturing 53 pips profit.
Strategy Tips
- Trade pairs with enough volatility such as EURUSD, USDJPY, GBPUSD and AUDUSD for clear swings.
- Wait for retracements toward the band or moving average before entering to improve reward to risk.
- Check a higher time-frame band slope such as H4 for overall bias to avoid trades against the major trend.
- Exit early if the histogram weakens before reaching the target to preserve capital.
- Scale out part of the position when the histogram remains strong over several bars to secure profit.
- Use proper position sizing based on stop-loss distance and account risk tolerance.
- Do not enter if bands flatten or histogram flips quickly after entry.
Download Now
Download the “band-moving-average.mq4” Metatrader 4 indicator
FAQ
What makes Band Moving Average different from standard moving averages?
Unlike a single moving average, this indicator adds tradable outer bands that create dynamic support and resistance zones for trend-based entries.
Can it be used for all trading styles?
Yes, the indicator adapts to scalping, intraday, and swing trading styles and works on any timeframe.
Does the slope of the bands matter?
Yes, an upward slope favors buying, while a downward slope favors selling.
Trade signals against the slope are considered countertrend.
Should additional confirmation tools be used?
Using price action or other indicators can improve accuracy and reduce false entries when trading near the bands.
Summary
The Band Moving Average indicator for MT4 provides a moving average-based channel system that highlights dynamic support and resistance levels.
Its slope-based signals help traders focus on trend-aligned entries.
This indicator fits traders who prefer trend-following strategies and want clear zones for buying and selling.
Its flexibility allows use across multiple timeframes and trading styles.


