
About the Bar Spread Indicator
The Bar Spread Indicator for MT5 is a practical tool that monitors the real-time spread between a currency pair’s bid and ask prices.
The spread represents the cost of trading and can change constantly depending on market activity and liquidity.
This indicator displays the spread in a separate window below the price area, allowing traders to observe how the spread behaves during different market conditions.
When markets become volatile or liquidity decreases, spreads often widen.
During stable trading periods, spreads typically remain tighter.
By tracking spread movements directly on the platform, traders gain better awareness of trading costs and potential execution conditions.
This information can be useful when planning entries, especially for scalpers and short-term traders who depend on low spreads.
Free Download
Key Features
- Displays the current bid-ask spread in real time.
- Plots the spread in a dedicated window below the price area.
- Helps traders monitor trading costs during different market conditions.
- Useful for identifying periods of high volatility when spreads widen.
- Simple visual display that updates continuously with market movement.
- Customizable colors and style settings.
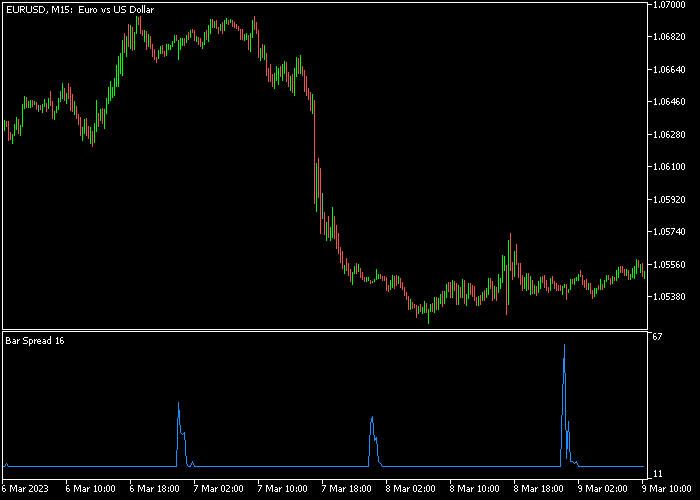
Indicator Chart
The Bar Spread Indicator appears beneath the main price area and shows the current spread as a changing line or bar value.
As market conditions shift, the spread value rises or falls, helping traders monitor execution costs while analyzing the market.
Guide to Trade with Bar Spread Indicator
Buy Rules
- Check that the spread remains stable and relatively low before entering a trade.
- Look for buying opportunities aligned with your primary trading strategy.
- Confirm that the spread is not widening rapidly during entry.
- Open the buy trade once market conditions remain favorable.
Sell Rules
- Monitor the spread to ensure it remains within normal levels.
- Identify sell opportunities using your preferred analysis method.
- Avoid opening trades if the spread suddenly expands.
- Enter the sell trade once the spread stabilizes.
Stop Loss
- Place the stop loss based on your strategy or nearby support and resistance.
- Consider slightly wider stops during high volatility periods.
- Avoid extremely tight stops when spreads are fluctuating.
Take Profit
- Close trades when your strategy signals an exit.
- Consider closing positions if spreads begin widening rapidly.
- Target nearby support or resistance zones for profit objectives.
- Use a trailing stop to secure profits during strong market movement.
Download Now
FAQ
What does the Bar Spread Indicator measure?
The indicator measures the difference between the bid price and the ask price.
This difference represents the trading spread charged by the broker.
Why is monitoring the spread important?
The spread directly affects trading costs.
When the spread widens, the cost of entering and exiting trades increases, which can impact profitability.
When do spreads usually widen?
Spreads often widen during major news releases, periods of low liquidity, or high volatility.
Monitoring the spread helps traders avoid entering trades during unfavorable conditions.
Who benefits most from this indicator?
Short-term traders and scalpers benefit the most because their strategies rely heavily on tight spreads and precise entry timing.
Summary
The Bar Spread Indicator provides a straightforward way to track the real-time spread directly within the trading platform.
This helps traders stay aware of trading costs while analyzing the market.
By observing how spreads change during different market conditions, traders can avoid entering trades during unfavorable periods.
This is especially useful during volatile sessions when spreads may expand.
The indicator’s simple display and customizable appearance make it a helpful addition to any trading setup, particularly for traders who want better awareness of execution conditions.


