
About the Bullish and Bearish Days Indicator
The Bullish and Bearish Days Indicator for MT5 highlights daily market trends directly on the price chart.
Blue colors represent bullish trading days, while red colors indicate bearish trading days.
By coloring entire trading days, this indicator helps traders quickly see whether the market has been moving upward or downward over multiple sessions.
This makes it easier to assess the broader trend and potential trading opportunities.
The tool works well for intraday and swing traders looking to align trades with the prevailing market direction.
Its visual approach allows even novice traders to interpret trend momentum without complex calculations.
Customizable inputs include bullish day color, bearish day color, and style, enabling traders to adapt the display to their preferences and trading strategy.
Free Download
Key Features
- Colors entire trading days to indicate bullish or bearish market direction.
- Blue represents upward trending days, and red represents downward trending days.
- Helps visualize multi-day market momentum at a glance.
- Customizable day colors and display style.
- Suitable for intraday and swing trading strategies.
- Allows traders to align trades with broader market trends.
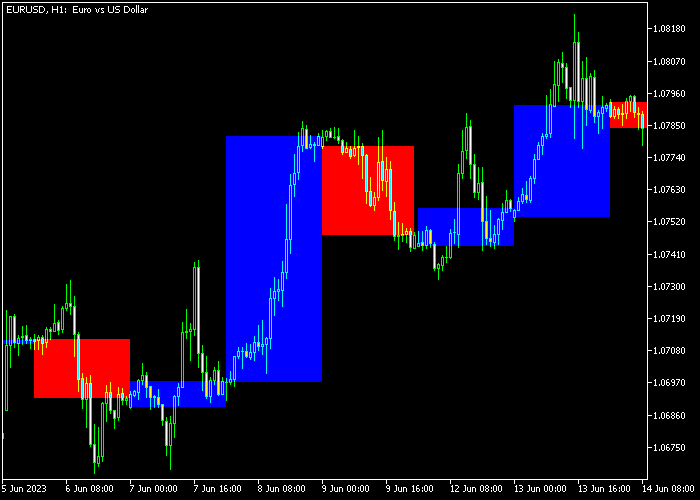
Indicator Chart
The Bullish and Bearish Days Indicator colors the background of the price chart according to daily trends.
Blue shading signals bullish days, while red shading signals bearish days.
Traders can quickly identify clusters of bullish or bearish days to understand the overall market sentiment and plan trades accordingly.
The indicator makes spotting short-term and multi-day trends more intuitive.
Guide to Trade with Bullish and Bearish Days Indicator
Buy Rules
- Identify blue-colored days on the chart to signal bullish momentum.
- Enter a buy position when consecutive bullish days appear.
- Consider entering trades in the direction of the majority of blue days.
- Monitor daily trend continuation for high-probability buy setups.
Sell Rules
- Identify red-colored days on the chart to signal bearish momentum.
- Enter a sell position when consecutive bearish days appear.
- Consider entering trades in the direction of the majority of red days.
- Monitor daily trend continuation for high-probability sell setups.
Stop Loss
- For buy trades, place the stop below the most recent swing low or support level.
- For sell trades, place the stop above the most recent swing high or resistance level.
- Use prior day highs and lows as guidance for protective stops.
Take Profit
- Close buy trades when a red day appears, signaling a potential bearish trend reversal.
- Close sell trades when a blue day appears, signaling a potential bullish trend reversal.
- Optional: scale out partial profits during mixed trend days.
- Use the appearance of the opposite-colored day as the main exit signal.
Bullish and Bearish Days Indicator Swing Strategy for MT5
This swing trading strategy combines the Bullish and Bearish Days Forex Indicator for MT5 with the No Lag MACD Indicator for MT5.
The Bullish and Bearish Days indicator highlights market bias clearly. Blue bars represent bullish days, while red bars indicate bearish days.
This gives a quick visual understanding of overall market direction and helps traders stay aligned with dominant pressure.
The No Lag MACD indicator confirms momentum with faster reaction compared to the traditional MACD.
When the histogram is above zero, it shows bullish momentum. When it is below zero, it signals bearish pressure.
This strategy works best on H1 and H4 charts.
It is ideal for swing traders who want to hold trades for several hours to a few days while following clear directional bias.
Buy Entry Rules
- Wait for the Bullish and Bearish Days indicator to show blue bullish candles.
- Confirm that the No Lag MACD histogram is above the zero line.
- Enter a buy trade at the opening of the next candle.
- Place the stop loss below the most recent swing low.
- Take profit when the MACD histogram crosses below zero or when bearish red candles appear, or close near a resistance level.
Sell Entry Rules
- Wait for the Bullish and Bearish Days indicator to show red bearish candles.
- Confirm that the No Lag MACD histogram is below the zero line.
- Enter a sell trade at the opening of the next candle.
- Place the stop loss above the most recent swing high.
- Take profit when the MACD histogram crosses above zero or when bullish blue candles appear, or close near a support level.
Case Study 1: Buy Trade Setup (EUR/USD, H1)
On the EUR/USD pair, the market shifted into a bullish phase with consecutive blue candles from the Bullish and Bearish Days indicator.
At the same time, the No Lag MACD histogram moved above the zero line, confirming upward momentum.
A buy trade was entered at the next candle. The stop loss was placed below the recent swing low.
Price continued to climb steadily over the next sessions.
The trade was closed for 149 pips profit when the MACD histogram crossed below zero, showing that bullish momentum had ended.
Case Study 2: Sell Trade Setup (GBP/USD, H4)
On the GBP/USD pair, the market showed consistent red candles, indicating bearish sentiment.
The No Lag MACD histogram remained below zero, confirming strong downward momentum.
A sell trade was opened at the next candle. The stop loss was placed above the recent swing high.
Unfortunately, the position was exited for a 50 pip loss when the no-lag MACD histogram crossed above zero.
Download Now
FAQ
Can this indicator be used on any timeframe?
Yes. While it tracks daily trends, traders can use it on smaller timeframes to align intraday trades with the broader market direction.
Does the color of the day repaint?
No. Once a day is complete, its bullish or bearish color remains fixed for reliable trend assessment.
How can I customize the colors?
Traders can modify the bullish and bearish day colors as well as the style to match their visual preferences and chart theme.
Is it suitable for short-term trading?
Yes. While it tracks multi-day trends, it can be used alongside shorter-term signals to confirm trade direction for intraday trades.
Summary
The Bullish and Bearish Days Indicator visually distinguishes daily market trends using blue and red shading.
It helps traders quickly identify the prevailing trend and multi-day momentum.
It is suitable for intraday and swing trading, providing a straightforward method to align trades with broader market direction.
Customizable colors and styles allow traders to adapt it to their charting setup.
By using the opposite-colored day as the exit signal, traders can capture trend reversals effectively.
Overall, it is a practical and easy-to-read tool for monitoring daily market sentiment and trading with confidence.


