
About the Camarilla Pivot Points Indicator
The Camarilla Pivot Points Indicator for MT5 is a versatile tool that calculates pivot points, support, and resistance levels to guide trade entries, exits, and stop placement.
Price trading above the pivot point signals bullish sentiment, while trading below signals bearish sentiment.
The indicator displays the main Camarilla pivot and multiple support and resistance levels directly on the main chart.
Customizable inputs include the calculation period (C period) and H1-H5 level labels.
This allows traders to adjust the indicator for different timeframes and trading instruments, including Forex, indices, stocks, and commodities.
Practicing on a demo account is recommended to become familiar with the indicator and how its levels react in different market conditions.
Free Download
camarilla_full.mq5 Indicator (MT5)
Key Features
- Displays Camarilla pivot, support, and resistance levels on the chart.
- Highlights bullish or bearish sentiment based on price relative to the pivot point.
- Customizable calculation period and level labels.
- Works on all MT5 timeframes and instruments.
- Helps identify potential entry, exit, and stop loss zones.
- Assists in trend-aligned trading strategies.
Indicator Chart
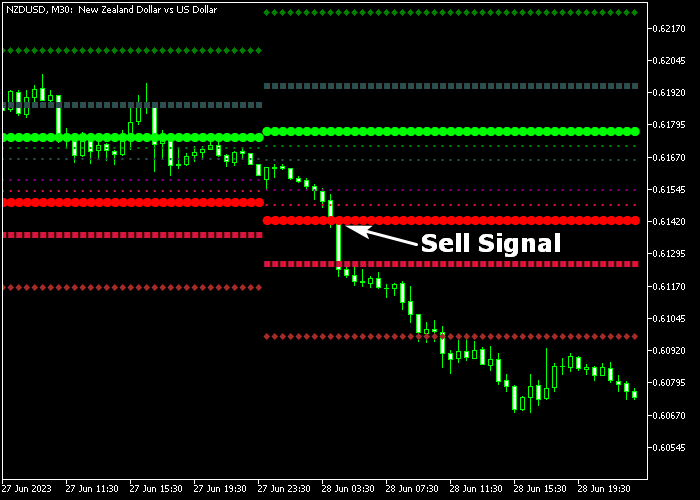
The Camarilla Pivot Points Indicator overlays key levels directly on the main price chart.
Thick green lines mark resistance levels and bullish zones, while thick red lines indicate support levels and bearish zones.
Traders can use these levels to plan entries, exits, and protective stop placement based on price interactions with the pivot levels.
Guide to Trade with Camarilla Pivot Points Indicator
Buy Rules
- Wait for the candlestick to cross above the green thick pivot line from below.
- Confirm the overall market trend is bullish.
- Open a buy trade at the next candle open.
- Avoid buying if price is trading near major resistance.
Sell Rules
- Wait for the candlestick to cross below the red thick pivot line from above.
- Confirm the market trend is bearish.
- Open a sell trade at the next candle open.
- Avoid selling if price is trading near a significant support level.
Stop Loss
- For buy trades, place a stop loss just below the nearest red pivot line or support level.
- For sell trades, place a stop loss just above the nearest green pivot line or resistance level.
Take Profit
- Close buy trades when price reaches any upper green resistance line.
- Close sell trades when price reaches any lower red support line.
- Partial exits can be taken at intermediate pivot levels to lock in profits.
- Monitor price action near pivot levels to decide whether to hold or exit early.
Camarilla Pivot Points Intraday Strategy with Tom Demark Moving Average
This intraday strategy blends the Camarilla Pivot Points Indicator with the Tom Demark Moving Average Indicator to help traders trade high‑probability reversals and trend continuations.
Camarilla Pivot Points offer precise support and resistance levels that reflect intraday market sentiment.
The Tom Demark Moving Average adds dynamic trend direction, helping confirm valid entries and avoid false signals.
You can apply this method on 5‑minute, 15‑minute, and 30‑minute charts.
It is designed for active traders who want defined entry and exit rules with clear risk targets.
This approach works well in liquid pairs such as EURUSD, GBPUSD, AUDUSD and USDJPY.
Buy Entry Rules
- Wait for price to cross above the green thick pivot line from below, showing a shift to bullish intraday sentiment.
- Confirm the Tom Demark Moving Average is signaling bullish momentum by the yellow MA line turning up.
- Enter a buy trade at the close of the candle that crosses above the green pivot.
- Place the stop loss just below the green pivot line or just under the recent swing low.
- Take profit at the next Camarilla resistance level or when the yellow MA flattens or turns down.
Sell Entry Rules
- Wait for price to cross below the red thick pivot line from above, indicating bearish intraday pressure.
- Check that the Tom Demark Moving Average is signaling downward momentum with the orange MA pointing down.
- Enter a sell trade at the close of the candle that crosses under the red pivot.
- Place the stop loss just above the red pivot line or just above the recent swing high.
- Take profit at the next Camarilla support level or when the orange MA flattens or turns up.
Case Study 1: USDJPY 15‑Minute
On the USDJPY 15‑minute chart, price approached the green thick pivot line early in the session.
After several attempts, a strong bullish candlestick crossed above the green pivot, signaling that buyers were gaining control.
At the same time, the Tom Demark Moving Average’s yellow MA line was sloping upward, reinforcing the bullish trend.
A buy trade was initiated at the close of the crossover candle with the stop loss below the pivot level.
Price continued higher toward the next Camarilla resistance.
The trade was closed near that level as the yellow line began to flatten, capturing a solid intraday move.
Case Study 2: EURUSD 5‑Minute
On the EURUSD 5‑minute chart, the price climbed toward the red thick pivot line after a strong early move.
A bearish reversal candle pierced below the red pivot, suggesting a shift toward sellers.
Concurrently, the Tom Demark Moving Average’s orange MA line was trending down.
A sell trade was entered at the close of the candle that crossed below the pivot with the stop loss placed above the pivot area.
Price slid downward efficiently, reaching the next Camarilla support zone before the orange MA showed signs of leveling off.
The short trade was closed for a clean 35 pip intraday profit.
Download Now
camarilla_full.mq5 Indicator (MT5)
FAQ
How does the indicator determine bullish or bearish sentiment?
Price trading above the pivot point is considered bullish, while price below the pivot point indicates bearish sentiment.
Pivot levels act as reference zones for market direction.
Can I customize the pivot levels?
Yes. You can adjust the calculation period (C period) and the H1-H5 level labels to match your trading timeframe and strategy.
Should I trade only around pivot levels?
Pivot levels are key zones for entries and exits, but they are most effective when used in combination with trend confirmation and market context.
Summary
The Camarilla Pivot Points Indicator helps traders identify key support, resistance, and pivot levels for more accurate entries, exits, and stop placement.
By monitoring price interactions with pivot lines, traders can detect bullish or bearish sentiment and make informed, trend-aligned trading decisions.
Customizable settings make it a practical tool for day trading, swing trading, and other strategies across multiple timeframes.


