About the Indicator
The Daily Pivot Points Indicator for MetaTrader 4 automatically plots the day’s pivot point along with support (S1–S3) and resistance (R1–R3) levels.
These levels help identify potential turning points, support/resistance zones, and guide trade decisions—all without cluttering your chart.
It’s free to download and suitable for both novice and experienced traders.
Free Download
Download the “DailyPivotPoints.mq4” indicator for MT4
Key Features
- Calculates pivot levels using the previous day’s high, low, and close.
- Plots central pivot (PP), and three levels of support (S1–S3) and resistance (R1–R3).
- Non-repainting—levels are static once plotted.
- Customizable line colors and styles.
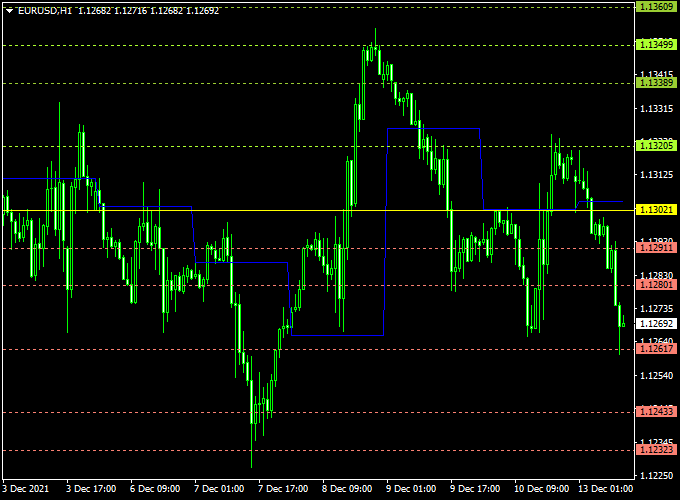
Indicator Example Chart (EUR/USD H1)
The example chart below displays the Daily Pivot Points MT4 indicator in action on the trading chart.

How to Use the Indicator
Pivot levels act as objective reference points. Use them as support or resistance, targets for entries or exits, or trend confirmation tools.
- Bounce Strategy: Enter long near S1 if bullish signals emerge; enter short near R1 when bearish patterns form.
- Breakout Strategy: Enter a trade after a candle closes above R1 or below S1, with momentum support.
- Trend Filter: If price stays above pivot, favor longs; if below, favor shorts.
Download Now
Download the “DailyPivotPoints.mq4” indicator for Metatrader 4
Pivot & Moving Averages Trend Dashboard MT4 Strategy
This strategy combines two powerful indicators: the Daily Pivot Points Indicator and the Moving Averages Trend Dashboard Indicator.
Together, they help traders identify key support and resistance levels and determine the prevailing market trend across multiple timeframes.
This approach aims to provide clear entry and exit signals, enhancing trading decisions.
What Is This Strategy About?
The core idea is to use the Daily Pivot Points Indicator to identify potential support and resistance levels for the day.
These levels act as reference points for price action.
The Moving Averages Trend Dashboard Indicator then provides a comprehensive view of the market trend across various timeframes.
By combining these tools, traders can make informed decisions, entering trades when the market is trending in their favor and avoiding trades during consolidation phases.
Buy and Sell Rules
Buy Setup
- Ensure the price is above the daily pivot point, indicating a bullish market sentiment.
- Check the Moving Averages Trend Dashboard for a bullish trend across multiple timeframes (e.g., 15-minute, 1-hour, 4-hour, daily, weekly).
- Enter a buy trade when both conditions align, confirming a strong upward trend.
- Set your stop loss below the daily pivot point or the nearest support level.
- Set your take profit at the next resistance level identified by the Daily Pivot Points Indicator.
Sell Setup
- Ensure the price is below the daily pivot point, indicating a bearish market sentiment.
- Check the Moving Averages Trend Dashboard for a bearish trend across multiple timeframes.
- Enter a sell trade when both conditions align, confirming a strong downward trend.
- Set your stop loss above the daily pivot point or the nearest resistance level.
- Set your take profit at the next support level identified by the Daily Pivot Points Indicator.
Trader Case Studies
Below are examples of traders from different parts of the world who successfully applied this strategy on various currency pairs and timeframes, showing its adaptability and effectiveness.
Samir D – Morocco
Samir D, a full-time trader in Morocco, used this strategy on GBP/USD and USD/JPY pairs for over a month. By aligning trades with the multi-timeframe trend and pivot points, he gained +370 pips.
Claire M – Australia
Claire M, a day trader from Australia, tested the system on AUD/USD and NZD/USD pairs for three weeks. Her careful execution resulted in a +280 pips profit during this period.
Daniel K – UK
Daniel K, a part-time trader based in the UK, followed this strategy for 20 days, focusing on EUR/GBP and USD/CAD pairs. He secured consistent gains totaling +140 pips by sticking to the rules.
Disclaimer: These case studies are for educational purposes only. Trading results depend on market conditions, risk management, and individual discipline.
Advantages
- Clear and objective entry and exit points based on reliable pivot levels and trend analysis.
- Helps manage risk effectively by using defined stop loss and take profit zones.
- Works well across multiple timeframes and currency pairs.
- Combines trend identification with precise timing to improve trade accuracy.
Drawbacks
- During low volatility or sideways markets, signals may be less reliable.
- False breakouts around the daily pivot point can sometimes trigger premature entries.
- Requires discipline to follow stop loss and take profit levels strictly.
Strategy Conclusion and Tips
This strategy provides a solid framework by combining the strengths of two effective indicators.
The Daily Pivot Points Indicator helps you understand market bias early in the day.
The Moving Averages Trend Dashboard Indicator gives clear entry and exit signals to maximize your gains.
For best results, trade during active market hours when volatility supports clear price moves away from the daily pivot.
Indicator Specifications
| Platform | MetaTrader 4 (MT4) |
| Levels Plotted | Pivot Point (PP), S1–S3, R1–R3 |
| Calculation | Based on the prior day’s High, Low, and Close |
| Timeframes | Any (M1–D1+) |
| Repainting | No—levels are static |
| Inputs | Line colors, styles, and visibility |
FAQ
Can it be used across timeframes?
Absolutely. Though computed daily, you can view and trade using its levels on any timeframe.
How are levels calculated?
Pivot = (High + Low + Close) ÷ 3. Support and resistance levels are derived from this using standard formulas.
Conclusion
The Daily Pivot Points Indicator offers clarity and structure. It helps you see where the price might reverse or continue, based on previous-day data.


