About the Demand and Supply Block Indicator
The Demand and Supply Forex Block Indicator for MT5 identifies the strongest supply and demand zones on the price chart.
Traders use these zones to determine optimal entry points, stop loss placement, and profit targets.
Green blocks mark major supply areas where price may reverse downward, while red blocks highlight major demand areas where price may bounce upward.
The indicator is highly customizable, allowing adjustments to show weak, untested, or broken zones, as well as alerts, border styles, and colors.
By visually marking these levels, it simplifies decision-making and improves trading precision.
Free Download
Demand and Supply Support and Resistance.mq5 Indicator (MT5)
Key Features
- Automatically detects major supply and demand zones.
- Green blocks for supply zones, red blocks for demand zones.
- Customizable inputs for history, alerts, and colors.
- Shows weak, untested, or broken zones for flexible trading.
- Helps identify precise entry, stop loss, and take profit levels.
Indicator Chart
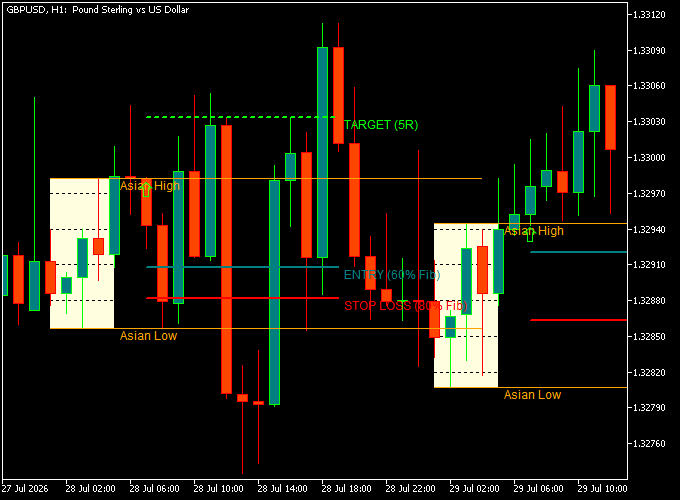
The chart displays the Demand and Supply Forex Block Indicator directly on the main price area.
Green blocks indicate major supply zones, while red blocks highlight major demand zones.
Traders can spot potential reversals and bounce points, visualize trend continuation, and identify trade opportunities using these blocks.

Guide to Trade with Demand and Supply Forex Block Indicator
Buy Rules
- Wait for the price to return to a major demand zone (red block) in an uptrend.
- Confirm the price reaction at the zone before entering.
- Place a buy order once the bounce is confirmed.
- Adjust trade size according to risk management rules.
Sell Rules
- Wait for the price to return to a major supply zone (green block) in a downtrend.
- Confirm the price reaction at the zone before entering.
- Place a sell order once the rejection is confirmed.
- Adjust trade size according to risk management rules.
Stop Loss
- For buy trades, place a stop loss just below the lower edge of the red demand block.
- For sell trades, place a stop loss just above the upper edge of the green supply block.
- Adjust the stop slightly beyond the block to account for volatility spikes.
- Use consistent risk sizing for each trade relative to your account balance.
Take Profit
- Close buy trades when the price reaches a nearby supply zone (green block).
- Close sell trades when the price reaches a nearby demand zone (red block).
- Optionally, use a trailing stop to lock in profits.
Demand and Supply with Breakout Indicator MT5 Scalping Strategy
This scalping strategy combines the Demand and Supply Forex Block Indicator for MT5 and the Breakout Indicator MT5 to capture fast continuation moves after pullbacks.
The Demand and Supply indicator identifies key zones where price is likely to react, based on institutional buying and selling areas.
These zones often act as strong support and resistance levels where price tends to reverse or continue.
The Breakout Indicator then confirms momentum by signaling when price breaks out of consolidation areas with strength.
This combination is ideal for scalping on 1-minute, 5-minute, and 15-minute charts, where quick reactions and precise timing are essential.
Buy Entry Rules
- Identify an uptrend on the chart by observing higher highs and higher lows.
- Wait for price to return to a major demand zone marked as a red block. This indicates an area where buyers are likely to step in.
- Do not enter immediately. Wait for confirmation using the Breakout Indicator.
- Enter a buy trade when a candle closes above the upper horizontal breakout line, confirming bullish momentum.
- Place the stop loss just below the demand zone to protect against false breakouts.
- Set a quick take profit at the next minor resistance level or use a tight risk-reward ratio such as 1:1 or 1:1.5.
- If momentum is strong, trail the stop below higher lows to capture extended scalping gains.
Sell Entry Rules
- Identify a downtrend by confirming lower highs and lower lows.
- Wait for price to retrace into a major supply zone marked as a green block, where selling pressure is expected.
- Avoid early entries and wait for breakout confirmation.
- Enter a sell trade when a candle closes below the lower horizontal breakout line, confirming bearish momentum.
- Place the stop loss just above the supply zone to limit risk.
- Set the take profit at the next minor support level or use a 1:1 to 1:1.5 risk-reward ratio for quick exits.
- If price continues downward strongly, trail the stop above lower highs to secure profits.
Cast Study 1
On the USD/CAD 5-minute chart, the market showed a clear uptrend with consistent higher highs.
Price retraced into a red demand zone, indicating a potential buying opportunity.
Instead of entering immediately, confirmation was awaited.
Shortly after, a candle closed above the upper breakout line, signaling strong bullish momentum.
A buy trade was executed with a stop loss below the demand zone.
Price quickly moved upward and reached the next resistance level, hitting the take profit target.
Cast Study 2
On the AUD/JPY 1-minute chart, the market was trending downward with clear lower highs.
Price retraced into a green supply zone, suggesting a potential sell opportunity.
A breakout confirmation was required before entry.
A candle then closed below the lower breakout line, confirming bearish momentum.
A sell trade was placed with a stop loss above the supply zone.
Price dropped rapidly toward the next support level, achieving the scalping target.
Download Now
Demand and Supply Support and Resistance.mq5 Indicator (MT5)
FAQ
Can I customize the zones shown by the indicator?
Yes, you can adjust settings such as weak, untested, or broken zones, as well as colors, alerts, and border styles.
How do I confirm a valid zone for trading?
Look for price reactions at the colored blocks, such as reversals or strong bounces. Multiple confirmations improve reliability.
Can this indicator be used for scalping?
Yes, the indicator works on smaller timeframes for scalping, but make sure to combine it with trend and momentum confirmation.
Summary
The Demand and Supply Forex Block Indicator for MT5 simplifies the identification of key market zones.
It marks supply and demand levels with red and green blocks, helping traders pinpoint entries, stop losses, and take profits.
Its customizable settings allow traders to adapt it to various strategies.
By clearly defining critical price zones, it enhances trading accuracy and confidence, reducing guesswork in decision-making.