
About the Detrended Synthetic Price Histogram indicator
The Detrended Synthetic Price Histogram indicator for MT4 is a momentum-based tool that highlights bullish and bearish price behavior using colored histogram bars.
It appears in a separate window below the price area and focuses on directional movement rather than raw price fluctuations.
Green histogram bars indicate bullish conditions, while red bars signal bearish conditions.
When no bars are displayed, the market is likely ranging or lacking sufficient momentum.
This makes it easier to stay active during trending phases and avoid low-quality setups during consolidation.
Its simple visual output allows traders to make faster decisions without overloading the chart.
Free Download
Download the “Detrended_Synthetic_Price_0histos.mq4” MT4 indicator
Key Features
- Displays bullish and bearish histogram bars in a separate window.
- Green bars indicate upward momentum.
- Red bars indicate downward momentum.
- Blank zones highlight range-bound conditions.
- Easy to combine with price-based tools.
Indicator Chart
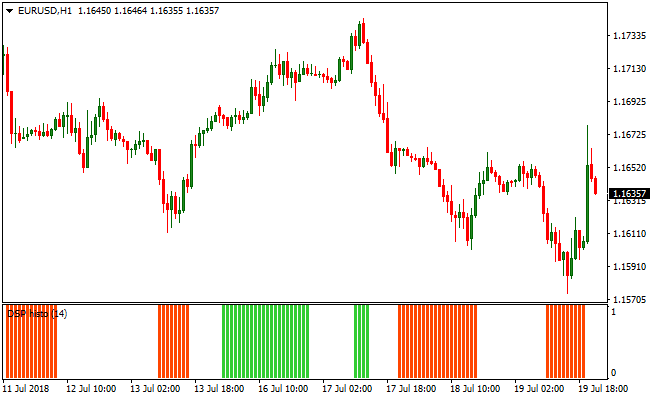
The image below shows the Detrended Synthetic Price Histogram indicator in a separate window.
Green bars appear during bullish momentum phases, red bars appear during bearish phases, and blank sections mark consolidation.
These transitions help traders time entries and exits with greater confidence.
Guide to Trade with Detrended Synthetic Price Histogram
Buy Rules
- Wait for the first green histogram bar to appear.
- Enter a buy trade at the close of that bar.
- Avoid trades during blank histogram zones.
- Focus on sequences of green bars for follow-through.
Sell Rules
- Wait for the first red histogram bar to appear.
- Enter a sell trade at the close of that bar.
- Avoid trades during range-bound conditions.
- Prefer trades supported by multiple red bars.
Stop Loss
- For buy trades, place the stop loss 3 pips below the nearest support level.
- For sell trades, place the stop loss 3 pips above the nearest resistance level.
Take Profit
- Close the trade when the opposite color bar appears.
- Exit fully after a strong run if blank bars begin to form.
Detrended Synthetic Price Histogram and Best Forex Scalping Indicator MT4 Strategy
This MT4 scalping strategy combines momentum direction with precise entry signals by using the Detrended Synthetic Price Histogram Indicator and the Best Forex Scalping Indicator.
The Detrended Synthetic Price Histogram displays a green histogram for buy trend conditions and an orange histogram for sell trend conditions.
The Best Forex Scalping Indicator adds accurate blue arrows for buy entries and red arrows for sell entries.
When both indicators agree, the chance of a successful scalp increases.
This strategy works best on M1 and M5 charts and is ideal for traders looking for quick, frequent opportunities aligned with momentum and timing.
Buy Entry Rules
- Confirm that the Detrended Synthetic Price Histogram is green, indicating bullish momentum.
- Wait for a blue arrow from the Best Forex Scalping Indicator.
- Enter a buy trade at the close of the candle where the blue arrow appears.
- Place a stop loss a few pips below the recent swing low.
- Take profit when the histogram turns orange or the next red arrow appears.
Sell Entry Rules
- Confirm that the Detrended Synthetic Price Histogram is orange, indicating bearish momentum.
- Wait for a red arrow from the Best Forex Scalping Indicator.
- Enter a sell trade at the close of the candle where the red arrow appears.
- Place a stop loss a few pips above the recent swing high.
- Take profit when the histogram turns green or the next blue arrow appears.
Advantages
- Combines trend momentum with precise scalping entry timing.
- Blue and red arrows make entry signals easy to follow.
- Suitable for fast scalping on M1 and M5 charts.
- Histogram direction helps avoid countertrend trades.
- Clear exit signals using histogram color changes or opposing arrows.
- It can be applied to a variety of currency pairs without adjusting settings.
Drawbacks
- Scalping profits depend heavily on low spreads and fast execution.
- Requires active screen monitoring during sessions.
- Signal frequency can vary depending on momentum strength.
Example Case Study 1
On USDJPY M1, the Detrended Synthetic Price Histogram turned green, confirming bullish momentum.
Shortly after, a blue arrow appeared from the Best Forex Scalping Indicator.
A buy trade was entered at candle close with a stop loss placed 3 pips below the recent swing low.
Price moved upward quickly and the histogram turned orange, signaling the exit.
The trade resulted in a 15 pip gain.
Example Case Study 2
On EURAUD M5, the histogram turned orange, showing bearish momentum on the M5 chart.
A red arrow then appeared from the scalping indicator.
A sell trade was entered at candle close with a stop loss set 4 pips above the recent swing high.
Price declined steadily and the histogram later turned green, signaling the exit.
The scalp closed with a 23 pip profit.
Using both indicators together helped avoid premature entry against the momentum.
Strategy Tips
- Focus on M1 and M5 charts during high liquidity sessions such as London and New York overlaps.
- Only take signals when both histogram color and arrow direction align.
- Adjust stop loss based on recent support/resistance price levels, not fixed pip values.
- Close trades early if an opposing arrow appears before the histogram color changes.
- Track which pairs produce the most consistent setups for this strategy.
- Keep position size small due to rapid scalping and tight stop loss levels.
- Use a trade log to refine entries and exits over time.
- Be patient and skip weak signals to preserve trading capital.
Download Now
Download the “Detrended_Synthetic_Price_0histos.mq4” Metatrader 4 indicator
FAQ
How does this indicator differ from standard histograms?
It focuses on synthetic price behavior rather than raw price movement, which helps reduce short-term noise and highlight directional phases.
What market conditions does it perform best in?
The indicator performs best during directional moves where momentum builds gradually instead of sharp, random spikes.
Do the bars lag price movement?
The histogram reacts to current price behavior and is designed to follow momentum rather than predict future moves.
Summary
The Detrended Synthetic Price Histogram indicator offers a straightforward way to track directional momentum using colored histogram bars.
By separating trending phases from range-bound conditions, it helps traders stay focused on periods where price movement has intent.
Its simple visual design works well across different timeframes and trading styles, making it a useful tool for traders who prefer momentum confirmation without complex overlays or signals.


