
About the DSS Oscillator indicator
The DSS Oscillator indicator for MT4 is a sophisticated momentum tool that blends the smoothing properties of the Exponential Moving Average (EMA) with the cycle-tracking capabilities of the Stochastic oscillator.
This hybrid approach allows the indicator to track price swings more effectively than standard oscillators by reducing the lag typically associated with trend-following tools.
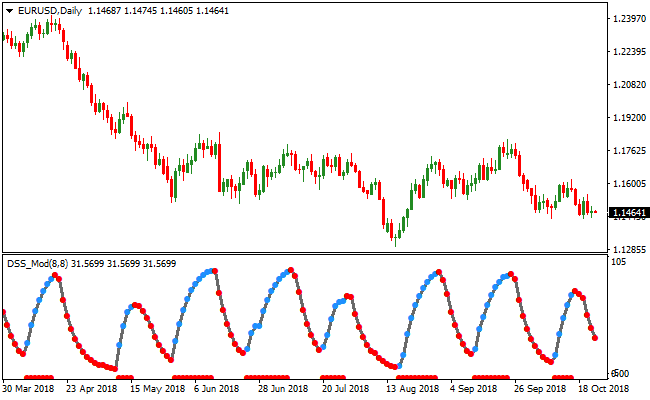
It operates within a specific range between 0 and 105, providing clear boundaries for market extremes.
By using this indicator, you can identify oversold conditions near the 0 level and overbought conditions near the 105 level.
A blue dot indicates the emergence of a bullish cycle, while a red dot warns of a bearish shift.
This dual-layered calculation makes it a reliable choice for traders looking to enter trends on high-quality pullbacks rather than chasing price at exhaustion points.
Free Download
Download the “dss-oscillator.mq4” MT4 indicator
Key Features
- Combines EMA and Stochastic calculations for a unique double-smoothed momentum output.
- Uses a color-coded dot system to highlight immediate shifts in trend direction.
- Features a specialized scale from 0 to 105 to define extreme market reversal zones.
- Reduces whipsaw signals by smoothing out price noise through internal averages.
- Provides fully customizable settings for both the EMA and Stochastic components.
- Works efficiently across all currency pairs, indices, and commodity charts.
Indicator Chart
The DSS Oscillator indicator appears in a window below the price candles, showing a moving line that changes color based on momentum.
You will notice blue dots forming when the momentum turns upward from the oversold region and red dots appearing when the momentum peaks in the overbought zone.
Guide to Trade with the DSS Oscillator Indicator
Buy Rules
- Confirm the price is trading above a long-term filter like the 100-period EMA.
- Wait for the DSS Oscillator indicator to reach the oversold area near the 0 level.
- Identify the first blue dot that appears as the oscillator begins to turn upward.
- Enter a long position immediately upon the close of the candle where the blue dot is confirmed.
Sell Rules
- Verify that the price action is currently below the 100-period EMA to confirm a downtrend.
- Monitor the oscillator as it climbs into the overbought territory near the 105 level.
- Wait for the DSS Oscillator indicator to print a red dot at the top of the cycle.
- Execute a short trade once the red dot is locked in at the candle close.
Stop Loss
- Place the stop loss order a few pips below the recent swing low for long setups.
- Position the stop loss order a few pips above the previous swing high for short setups.
- Ensure the stop level is outside of immediate market noise to prevent premature exits.
Take Profit
- Exit the trade when the oscillator reaches the opposite extreme level.
- Consider closing the position if a dot of the opposing color appears.
- Utilize a trailing stop or a target based on the next major support or resistance zone.
DSS Oscillator + Optimized AMA Forex Intraday Strategy for MT4
This MT4 strategy focuses on intraday trading using momentum signals and trend confirmation to find precise entries.
The DSS Oscillator Indicator shows buy signals with a blue dotted line and sell signals with a red dotted line.
The Optimized AMA Indicator confirms the trend. A blue dotted line indicates a bullish trend, and a red dotted line indicates a bearish trend.
This strategy works well on M5, M15, and M30 time frames.
Using the DSS Oscillator to time pullbacks and the Optimized AMA to confirm trend direction improves the chances of successful trades.
Buy Entry Rules
- Optimized AMA shows a blue dotted line indicating a bullish trend
- DSS Oscillator shows a blue dotted line, confirming a buy signal
- Enter a buy trade at the open of the next candle after both signals appear
- Place a stop loss below the recent swing low or minor support
- Close the trade when the DSS Oscillator shows a red dotted line or the AMA turns red
Sell Entry Rules
- Optimized AMA shows a red dotted line indicating a bearish trend
- DSS Oscillator shows a red dotted line confirming a sell signal
- Enter a sell trade at the open of the next candle after both signals appear
- Place a stop loss above the recent swing high or minor resistance
- Close the trade when the DSS Oscillator shows a blue dotted line or the AMA turns blue
Advantages
- Combines trend confirmation and momentum signals for higher accuracy
- Suitable for multiple intraday time frames from M5 to M30
- Helps traders capture short-term moves efficiently
- Reduces the likelihood of counter-trend entries
- Works well on a variety of currency pairs, including majors, minors, and exotics
- Quick entries and exits make it ideal for scalping and intraday trading
- Can be combined with support and resistance levels for additional confirmation
- Helps identify pullbacks within trends for better timing
Drawbacks
- The AMA trend can lag slightly during fast price movements
- Trades may be missed if DSS and AMA signals do not appear simultaneously
- Performance can vary depending on the chosen currency pair and time frame
Case Study 1
On EURUSD M15, the AMA showed a blue dotted line indicating a bullish trend.
The DSS Oscillator showed a blue dotted line at 1.1018.
A buy trade was entered at 1.1020 with a stop loss at 1.1005 below the swing low.
Price moved up to 1.1052, reaching resistance and closing the trade with 32 pips profit.
Trend and momentum alignment made the trade precise and reliable.
Case Study 2
On GBPJPY M5, the AMA turned red, indicating a bearish trend.
The DSS Oscillator showed a red dotted line at 162.48.
A sell trade was entered at 162.45 with a stop loss at 162.70 above the swing high.
Price dropped to 162.10, reaching support and closing the trade with 35 pips profit.
Combining trend and momentum signals allowed for a fast and accurate scalp.
Strategy Tips
- Focus on trending currency pairs to increase the probability of successful trades
- Use higher time frames to confirm the main trend before entering intraday trades
- Wait for full confirmation from the DSS Oscillator before entering a trade
- Combine with simple price action patterns to improve entry accuracy
- Adjust stop loss and take profit according to recent swing highs and lows
- Trade during active sessions for stronger and more consistent price moves
- Skip trades when the trend and momentum signals are weak or unclear
- Consider partial exits if a strong trend continues beyond the first target
Download Now
Download the “dss-oscillator.mq4” Metatrader 4 indicator
FAQ
What is the benefit of the 105 level in the DSS Oscillator indicator?
While standard oscillators stop at 100, the DSS Oscillator indicator uses a slightly wider range up to 105 to account for the double-smoothing process.
This allows the indicator to stay in the overbought or oversold zone slightly longer, giving you a better view of when momentum has truly reached its limit before a reversal begins.
How do I avoid false signals in a ranging market?
The most effective way to filter out poor signals is to strictly follow the trend-following rule.
By only trading blue dots when price is above the 100 EMA and red dots when price is below it, you stay aligned with the dominant market flow.
Does the DSS Oscillator indicator work well with Bollinger Bands?
Yes, combining this oscillator with Bollinger Bands is a popular strategy.
You can look for a blue dot to appear when price touches the lower band or a red dot to appear when price hits the upper band.
This adds an extra layer of confirmation regarding price exhaustion and volatility.
Summary
The DSS Oscillator indicator offers a refined approach to momentum trading by merging two of the most popular technical tools into one interface.
Its ability to provide smoothed signals through color-coded dots makes it incredibly user-friendly for traders of all experience levels.
By focusing on the interplay between the 0 and 105 levels, it helps you time your entries with the rhythmic nature of the market.
When integrated into a complete strategy with a trend filter, it becomes an essential component for capturing high-probability swings while avoiding common market traps.


