
About the Dynamic Pivots Indicator
The Dynamic Pivots indicator for MT5 helps traders identify key turning points directly on the price area using automatically calculated pivot levels.
These pivots adjust with market movement and provide a practical reference for potential support and resistance zones during the trading session.
The indicator plots a central pivot line along with additional resistance and support levels.
When prices move above or below these levels, it often signals a shift in short-term market sentiment.
Traders use these signals to anticipate possible breakouts, reversals, or continuation moves.
Because the levels are generated dynamically, they adapt to current market conditions rather than relying on fixed historical calculations.
This makes the indicator useful for intraday traders who need quick confirmation of momentum changes.
Free Download
Dynamic pivots.mq5 Indicator (MT5)
Key Features
- Plots a central pivot level that reflects the current market balance point.
- Displays dynamic resistance and support levels directly on the price area.
- Helps identify bullish and bearish breakouts based on candle closes.
- Adapts pivot levels as market conditions change.
- Allows customization of colors and line styles.
Indicator Chart
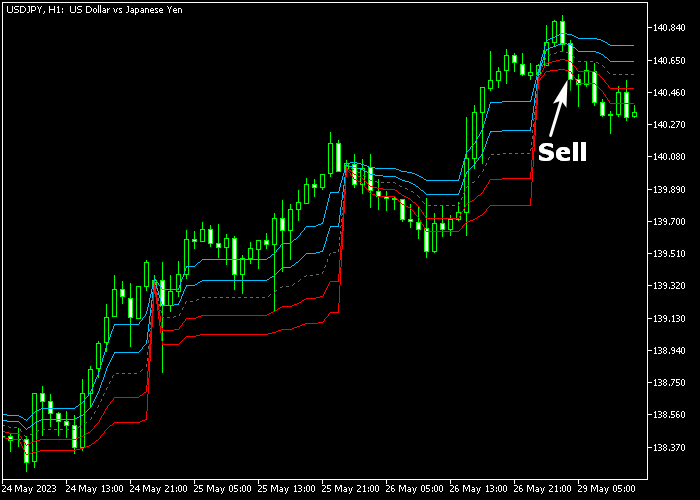
The Dynamic Pivots Indicator displays a central gray pivot line with blue resistance and red support levels beneath the main price area.
The example shows how price reacts to these levels as candles close above resistance for bullish setups or below support for bearish setups.
Guide to Trade with the Dynamic Pivots Indicator
Buy Rules
- A buy signal is considered when the price trades and closes above the central pivot.
- Open a buy trade once the price breaks through a red resistance level with momentum.
- Ensure the candle body is strong and closes convincingly above the targeted level.
- Maintain the position as long as the price stays above the nearest green support level.
Sell Rules
- A sell signal is considered when the price trades and closes below the central pivot.
- Open a sell trade as soon as the price breaks below a green support level.
- Look for a cluster of bearish candles to confirm a move toward the lower targets.
- Keep the sell order active until the price reaches the final red support objective.
Stop Loss
- Place your stop loss slightly below the previous swing low or the nearest green line.
- For sell trades, set the stop loss above the recent swing high or the nearest red line.
- Adjust the stop loss to breakeven once the price moves past the first target level.
Take Profit
- Close the buy trade for a fixed profit at the next major red resistance level.
- Exit the sell trade when the price reaches the predetermined green support target.
- Consider closing half the position at the first level and trailing the rest for a larger move.
- Liquidate the trade if the price fails to break a level and shows a strong reversal.
Dynamic Pivots and Ehlers Laguerre Filter Day Trading Strategy for MT5
This strategy blends the Dynamic Pivots Indicator with the Ehlers Laguerre Filter Indicator to create a refined intraday trading method.
It is designed to identify directional bias early and confirm entries with a smooth, responsive trend filter.
The Dynamic Pivots indicator provides a central pivot level that acts as a real-time reference point for market direction.
When price trades above this level, buyers are in control, while trading below signals selling pressure. This gives a clear structural bias before entering any trade.
The Ehlers Laguerre Filter enhances this by smoothing price action and reducing noise, making the underlying trend easier to read.
It reacts faster than traditional moving averages while still filtering out minor fluctuations, allowing traders to focus on meaningful direction changes.
This approach is suitable for M5 and M15 timeframes and works best during active sessions where price respects intraday levels.
Buy Entry Rules
- Wait for price to close above the central pivot level from the Dynamic Pivots indicator.
- Confirm that the Ehlers Laguerre Filter line is green, indicating upward momentum.
- Enter a buy trade after a minor pullback followed by a bullish candle.
- Place the stop loss below the pivot level or below the pullback low for tighter control.
- Take profit near the next resistance zone or exit if the Laguerre line turns red.
Sell Entry Rules
- Wait for price to close below the central pivot level from the Dynamic Pivots indicator.
- Confirm that the Ehlers Laguerre Filter line is red, indicating downward momentum.
- Enter a sell trade after a small retracement followed by a bearish candle.
- Place the stop loss above the pivot level or above a recent rejection high.
- Take profit near the next support area or exit if the Laguerre line shifts to green.
Case Study 1: EURUSD M5 Intraday Continuation
During the London session on EURUSD M5, price moved above the central pivot level and stayed there, confirming bullish control.
After a brief pullback toward the pivot, the Ehlers Laguerre Filter remained green and maintained a steady upward slope.
A buy trade was triggered after a bullish candle formed following the retracement.
The stop loss was placed just below the pullback structure rather than directly at the pivot, giving the trade enough room to develop.
Price continued higher with consistent movement, supported by the upward slope of the Laguerre Filter.
The buy trade was closed as price approached a resistance zone and the indicator began to flatten.
Case Study 2: GBPJPY M15 Intraday Reversal Shift
On GBPJPY M15 during the New York session, price initially traded above the pivot but failed to hold that level and dropped below it with a strong bearish candle.
This shift signaled a change in market sentiment.
The Ehlers Laguerre Filter turned red shortly after, confirming downward pressure.
A sell trade was entered after a small retracement back toward the pivot, followed by a bearish continuation candle.
In this case, the stop loss was placed above the pivot level itself, using it as a structural barrier.
Price moved lower steadily as the Laguerre Filter maintained its downward direction.
The short trade was exited once price slowed near a support area and the indicator began to level out.
Download Now
Dynamic pivots.mq5 Indicator (MT5)
FAQ
How are the pivot levels calculated in the Dynamic Pivots indicator?
The indicator calculates pivot levels automatically using recent price data.
These values adjust as new candles form, allowing the levels to reflect the most recent market activity.
Can the Dynamic Pivots indicator be used for breakout trading?
Yes. Many traders use the resistance and support levels as breakout triggers.
When a candle closes beyond these levels, it often signals that momentum is shifting in that direction.
Can I customize the appearance of the pivot levels?
Yes. The indicator settings allow traders to modify colors and line styles.
This makes it easy to adapt the display so it fits naturally within an existing trading setup.
Summary
The Dynamic Pivots indicator provides traders with a practical way to track important price levels during active market conditions.
By plotting a central pivot together with resistance and support levels, the tool highlights areas where price is likely to react.
Traders can use the indicator to identify breakout opportunities, confirm momentum shifts, and manage trades around key levels.
The dynamic nature of the pivot calculations keeps the levels relevant as the market evolves.
Its straightforward signals, flexible settings, and compatibility with multiple timeframes make it a useful addition to many MT5 trading approaches.


